I'm a student to electrical engeneering on my 3rd year. Only now, AT THIS VERY MOMENT, thanks to this lecture, I truly understand Fourier Transform. Thanks!!! It has been occuping my mind many times.
yes... this is by far the simplest and clearest explanation of DST/FFT. something that is usually approached from a mathematical point of view instead of an intuitive one. i knew someone out there had thought of explaining this from an intuitive angle. i want to know more people like you. i am now following you on twitter. thanks for sharing
this is remarkable. of all the videos on fourier transforms this is the only one that actually explained it in a meaningful way. watching this video, i understood how it worked before I even knew I did. i was like holy crap, i understand it.
I am a nurse practitioner in cardiology/electrophysiology. The Fast Fourier Transform is now being used to analyze the electrocardiograms of heart failure patients to help determine which patients might respond to therapies such as biventricular pacing. The initial results have been promising. THANK YOU FOR INCREASING MY UNDERSTANDING.
As a vibration engineer, I have spent my decades analysing machinery vibrations to detect machine faults. I have always defended use of this know how on human body, especially the cardiac system. In machinery we detect faults by observing deviation of vibration spectra from what is accepted as normal. I think, same could be applied to cardiac system to obtain the signature of a normal heart and compare patients' signature to it.
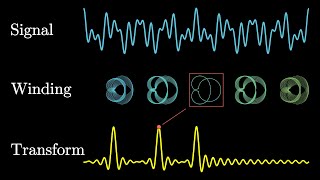
Excellent explanation!!! If you are confused by the "winding clock" description, please just realize that the "clock" is rapidly advancing thru MANY frequencies. Each measured frequency is a snapshot of that "clock". If you were to stop that clock, you would see the result for that one frequency (where you happened to stop). The Fourier Transform calculates the "mutual alignment" of all the circling data. Mostly, the alignment is poor and the value is low. When the circling data all converges to a specific unified shape, the resulting score is high. This means that the FFT result for that specific frequency also goes high. Furthermore, this means that that frequency is a partial component of your original data (heartbeat, tide distance, etc.)
I am an engineer and though i am not directly into signal processing and FFT stuff, I do interact with other groups who do this. Tried to understand this to the core, but could not until i see this. Probably this is the way, one has to understand things, feeling fortunate to get across this video from vast signal processing videos available in the ocean of internet. Thanks a lot for posting this.
"Take the data and multiply it by circles" - THANK YOU!! Finally someone demystifies this horrendous looking equation :'D Great presentation, will have to watch back a few times.
and for laplace mutiply the circles with exponential functions (growing and decaying) as some systems may contain exponential growth and decay. pi models all types of circles whereas e models all types of growth/decay when you play with its exponent part (think about compound interests and the fact that the derivative of e is itself)
Excellent! I could never quite keep the details of FFT or its purpose in my head, because it was always so abstract. Now I'm stoked to use it to write a voice recognition script!
Great talk! The DFT is such an incredible tool! I'm halfway through, and wanted to mention that there are many times when the phase is EXTREMELY important in understanding your data (in many cases, the more important part of the data)... so not to think of it as something that should be 'disregarded' (around 17:30)... for example, look up X-Ray crystallography :)
I have worked with fourier transform for some time. I have even made my own FFT program that actually worked. But I did't understand it completely until now. Thank you very much.
This is the best illustration of how computers can help us visualize and understand mathematics better than math on a page. Thank you for sharing this great lecture.
I am currently studying the characteristics of turbulence as computed using Large Eddy Simulation, in particular, the time history of turbulent fluctuations. I found this video extremely helpful in terms of how I can analyse my data. Thanks, and I feel lucky that I found this video!
I am still watching the video, I didn't finish it, but I must say even now that you described it very well! I understood everything to this point. Great work!
wow this was a brilliant presentation! Really helpful - good structure, very depicted Explanation, great style of talking :) Thank you for your effort!
Excellent teaching! I am a mechanical/manufacturing engineer and I have occasionally used FFTs without really understanding the details since it was not in my coursework. Your explanation makes sense. It has previously baffled me where the frequency measurements come from. This will help me to better understand the details of vibration analysis I am performing. As a fellow mandolin player, I also appreciate your use of a guitar in the description. Guitar is probably a bit more interesting with the over tones than the mando...
Despite some disconnects between the slides and the narration, and one mistake in the slides that had me really confused for a bit, this is probably the BEST intro to the FFT algorithm I've ever seen. Most devolve into abstract formulas and gloss over how they work. I've known for a long time what FFTs do (even used them in my code), but they've always been a black box to me; I never really understood the concept behind them. Thanks for posting this!
What are the odds? I was looking for this type of explanation and i would have skipped the struggle to understand this topic 'INTUITIVELY' if it had kept me confused for more than 24 hours. Before I could google it or search here, I found this as a suggested video. This is an amazing lecture and I don't need to watch any other. I have now understood what i was looking to. Considering the complexity of this topic, We both cannot Imagine how much time of struggle I have saved after watching this lecture. Grateful to you and Google's AI.
Nice video. It was always a little like witchcraft in the back of my mind, but I accepted it working with a leap of faith because it always did. I think you just taught it to the other half of my brain.
+gallamine I've forgotten that I've written this comment; reading it again I see that I've used both engineering and physics notation for sqrt(-1) so it is quite easy to make these errors :) I've enjoyed the video a lot. Thanks for sharing!
It's traditionally the sum, not a difference. Note that technically one could write the Euler's formula as sin(x) + j cos(x). The only difference is you would start at (0,1) and rotate clockwise.
Hi, one question that has intrigued me: why the need to overlap the the sample window when doing FFT on the fly on a signal ? if we take the FFT on a sample and convert it back then there is no change in the signal (the output is exactly like the input); if we take the FFT on a sample but modify in some way the output of the FFT (i.e. apply a filter of some sort) and then convert back into time domain, then at the beginning and the end of the same we get some kind of "chirps". Why ???
1) watch the section on window functions. Without a window function the signal-to-noise ratio isn't good. 2) The window function reduces the energy at the beginning and ending of the data window. The overlapping is so that an interesting bit in your signal wont be lost if it happens to be at the beginning or end of each window (due to the window function reducing the energy there).
@gallamine, can you point out some direction on how to "measure your energy or sleep and see if there are time cycles"? I got interested on that. Thanks. Very good video!
4:30 If I'm not making a mistake here - non-native English speaker -, what you'd call the hour hand of the clock is what moves around the circle in 12 hours' time (not 3600 s, which is an hour), the minute hand what moves around the circle in an hour's time (not 60 seconds, which is a minute), and the second hand what moves around the circle in a minute's time (not 1 s, which would be very fast).
Why didn't I understand this when I was learning about FFT in college ... was I not paying attention, or was it not taught very well? I'll never know. Thanks for presenting it using these more intuitive concepts than the abstract way I was forced to learn it. I'm jealous of kids today who have the internet at their fingertips ... what an advantage when it comes to learning otherwise challenging concepts.
Wonderful lecture! But the audience would benefit if you’d introduce and distinguish between terms like frequency of sampling and frequency of the moving point
Thanks for this video. Why does the circular plot at 10:54 look so different from the one at 8:54? Is it because you are using another data set here? If not, please explain the mapping. I understand the rectangular graphs on the right on 10:54 (averages and vector magnitude), I just don't get how you get from the circular plot at 8:54 to the circular plot at 10:54.
+Rasmus Rønn Nielsen Great question! I didn't mention it as to not confuse people too much. I simply added a fixed-value offset to the plot in 10:54 - I did this so it was more easy to see the lines. That just means for each value I added a fixed number (like 10) to it to push it away from the origin. It doesn't actually change much at all - all of the averages will be raised by a fixed amount. This is also why, at the end of the talk, I mention that best practice is to remove the DC, or average, value of the entire signal before taking the FFT - it just makes things easier, but doesn't really change things much in the end.
Hi, thank you, this is amazing. I wish there was more resources out there like this. Can you tell me, is your technique of wrapping the signal round a circle and finding the 'centre of mass' different mathematically from the conventional Fourier Transform? From what I understand the convention formula is convolving the signal by sine and cosine waves that sweep through all frequencies. Is your circle that the signal wraps around the same thing as the sine and cosine in the formula?
+nicksworldofsynthesizers yes. The first several minutes of the presentation are showing how sine + cosine is a circle. The conventional presentation of the fourier transform is (in my opinion) designed for compactness, elegance, and convenience for giving engineering students homework problems.
+gallamine your animation has enabled me to visualise Fourier Transforms in my head. I can see how a bell curve is it's own FT just by stretching it round a circle. How hard would it be to do the equation in one's head. I would rather be a human with understanding than a robot with knowledge :)
Hi, thank you for this amazing video. I am not getting how the different frequencies are represented by different circles. I can see when we increase the frequency the "2D plot" spreads but I don't understand what changes in the circle when we change the frequency that makes the plot spread. Cause I think however fast we move (the minute hand moves), the spatial distance in 2D will remain the same with respect to Ts as it is the interval at which we're putting the 1D data on 2D plane!?! and by keeping the sample data and the radius of circle same arent we putting a limit on the Ts (the interval at which we plot in the 2D space)? and by different frequencies if we're sampling the 1D plot again at those frequencies shouldn't the 2D plot appear the same? :( Can you please explain how the circles are different with respect to frequencies? Do the frequencies determine the interval (angle spread) at which we plot the 1D points in 2D? Many thanks.
Hey William! Sorry for my late reaction and thanks for your quick answer! I was kind of busy in the last weeks and didn't want to answer before I actually tried to replicate your work. Now I did and it worked. Thanks !! I didn't know about ffmpeg and I feel very grateful about your hint. Thanks again, Flo
what is wrapping of a signal around a circle. when you mean vector do you mean freezing all the rotators and taking all x's and summing to get avg X ? and similarly y?
Excellent explanation! Just one question: On the "Projecting onto the circle" slide (7:09) the time series signal gets projected onto the three circles with each circle having a vector with different angle speeds. The sum of the vectors of the points on the circles determine the power that correspond with that angle speed (or frequency). How did you determine / choose the speed at which the time series signal itself gets 'fed' into the circles? Does it correspond with the frequency sample? If so is my assumption correct that sample frequency and sample length impose a limit on the lowest measurable frequency? (lowest freq = samples / frequency)
JRprofucktions in order to make sense of the data you need to keep some reference. This is usually the sample rate (F_s) which 1 over the time between samples (Ts). In the illustration at 7:09 there are 3 circles - each is rotating at 1, 2 and 3 times-per-second - or 1Hz, 2Hz and 3Hz respectively. The data is about 2.5 seconds long and was sampled at (I think) 100 Hz - or 100 samples every second (for a total of 250 samples). The data points are evenly distributed (in angle) around the clock face - i.e. the 1hz clock will have 100 samples distributed around it's perimeter. The lowest measurable frequency is 0 Hz (no rotation, or the average of all the sample values). Frequencies below 1 Hz are fractional. Negative frequencies just indicate the clock is turning in the opposite direction and works out to be the same as the positive frequency value. The *highest* frequency is al little trickier - it's actually F_s/2. Does that help?
gallamine I have tried to understand the mechanism by which these arms are deduced with no luck. I thought the third circle is the vector sum of both the first and second. Can you please elaborate in this point , how the arm lengths are estimated.
Muhammad Nada The three circles are independent. Three different rotation rates or frequencies. The arm length is the magnitude of the signal at the top - the value of the red dot. It isn't an estimate, I just make the arm length equal to the signal value at that time. The fact that the 3rd circle chart doesn't have a blue line drawn is just a mistake on my part. HTH.
Mr. Gallamine, thanks for the video... After 40 minutes reading through the comments, I think that what you said in this reply: "The data points are evenly distributed (in angle) around the clock face - i.e. the 1hz clock will have 100 samples distributed around it's perimeter." made a great deal of contribution to my understanding of what really means ""Projecting onto the circle". Thanks.
I think putting "The fact that the 3rd circle chart doesn't have a blue line drawn is just a mistake on my part." as a note on the video, would better help others to understand that slide.
Am I crazy or did he mess up Euler's identity at 15:10. Shouldn't it be e^jx = cos(x) + jsin(x)? Since cos is real and sin is imaginary in rectangular form. If not, how is he able to switch the cos and sin?
at 6:42: It's clear to me that the length of the arm represents the absolute value of the signal, but what does the angle represent? You say that "when the measurement is negative the clock arm switches direction" but that doesn't seem to be true. If I understand correctly, the frequency attributed to each circle represents the frequency that the signal is being sampled. So I thought maybe the angle represents the phase of the sampling period (For example: a a sampling takes place every full cycle), but if that were the case then shouldn't each individual arm be moving at a constant rate? Because it is clear that the angular speed of each arm isn't constant, and I actually timed it and got that some cycles take twice as long than others. This shouldn't happen if the red dot is in fact moving at a constant (horizontal) speed. Maybe I'm mistaken in the angle representation tho.
+rksilvergreen at that point in the presentation (slide titled Projecting onto the Circle) I'm showing what happens if you take 3 clocks at 3 fixed rotation rates and adjust the length of the "clock arms" to correspond to the measured signal. The angle of each clock arm is simply a factor of how fast they're rotating. One of the clocks is rotating once-per-second (1Hz). That means for a measured signal 3 seconds long, the clock will make 3 rotations. When the "signal value" is below zero, then the length of the clock hand is reversed (it flips 180 degrees). So the actual angle the clock hand makes will be (clock_speed * measurement_time * 360 degrees). So, at time 0.5 seconds, a clock rotating at 1Hz will be at an angle 0.5*1*360 = 180 degrees. Hope that helps! Don't be discouraged if you don't get this stuff right away. It took me a long time.
+gallamine Thanks for the answer. Sorry if I'm being extremely ignorant here but: a) I've actually timed each clock twice now and it I get very different cycle times for each clock (even for my crude human measurements). Might be a technical error. b) You can take a snapshot at, for example, 7:04 when the signal value is 0.5 and 7:17 when the signal value is -0.5. If I understand you correctly then there should be a 180 degree shift for each arm, but if you look at clocks 1 and 3 (2 is borderline correct), there clearly isn't. Plus, assuming the clocks are rotating at a constant rate, why would their angles correspond to the signal value? I'm not trying to be petty but I just want to understand this correctly because it's the basis for the next slides :)
+rksilvergreen a) the three clocks shown on the "Projecting onto the Circle" slide are rotating at three different rates. This is why they're labeled - frequency 1, frequency 2 and frequency 3. b) It seems we're talking past each other on this issue. All I can advise is to perhaps look at the code used to generate the plots (Cell 116 here nbviewer.ipython.org/github/gallamine/fft_oscon/blob/master/OSCON%20Rev1.ipynb). Also consider a polar plot - to draw a polar plot you chose and *angle* (clock_speed * measurement_time * 360 degrees) and you choose a *length* - that's the signal value at that time, which determines how far from the center of plot the line extends. When the measurement has a negative sign, the length is negative and is plotting extending the opposite direction. Sorry I'm not able to make it more clear!
Great video! Never thought the Fourier Transform could be so easy to understand! Is there also an intuitive way to understand the FFT algorithm? What is it that makes it fast? Which property does it exploit? Are some of the sin/cos calculations reused for multiple frequencies?
hi do you by any chance have any source's somewhere? (for the python code) not that it's alot of code :) I could just type it over. but just wondering, as a reference :)
i don't understand why windowing improves things? can someone give me a simple explaination of that? how does cutting off the frequencies near the beginning and end help sharpen things up?
I have a clock and the hour hand takes 12 hours to make one revolution. Won't the angular speed of the hour hand be 2*pi/12X60X60 radians per second? See the 4:30 mark of the video. Thanks.
Hellow. I don't understand something. Does the arm of the clock represent an absolute value of the signal? When red dot is on value 1.0 or -1.0 for example the arm lenght is 1.0. If so how the sign of the graf is tranlated in to the circle diagram? Also at 7:39 you say" when the measurment is negative the clock hand switches directions" what does it mean?
That is what confused me - watching the clock representation at about 6:42, no matter if the red dot is on +1 or -1, the middle clock is at approx. 135 degrees and the length of the clock arm is the same. No difference between -1 and +1.
Dyda tom the *absolute* value of the signal is the "hand" length. A signal of +1 and -1 both have a length of 1. What changes is the rotation - or phase - of the signal. + to - results in a rotation of 180 degrees.
I am pretty sure this guy has never seen an analogue clock before. Shows the hands moving CCW, says that it takes the hour hand 360 seconds to make one complete revolution around the clock face, botches the speed of the minute and se one hands as well. I will seek out a different FT video now thank you very much.
I do not think the aim of this video is to explain in a deep way the mathematics. It is only a 37 minutes video. For people who are studying this and have spent a lot of time understanding mathematics but are still struggling with the concept, this video is very good. I do not mind if some calculus are wrong. Ideas are very well showed and simulations are very helpful. I do not understand why people criticize this. Good job man
***** due to what's called "aliasing" information that's multiples of the 0.5*sampling_rate will be visible in the spectrum. This gets tricky because you know which multiple it is. Generally you will *first* filter the signal to remove high frequency information and then compute the FFT, but you can *bandpass* filter your signal first and then use a technique like undersampling to observe the frequency information of signals at much higher rates than your sample rate (en.wikipedia.org/wiki/Undersampling). That said, for general sampling and frequency observation you'll need to sample at *twice the maximum frequency you want to observe.*
Very nice explanation :-)I have one one major doubt. I know fft should be 2 dimensional because we are multiplyig the signal with spiral signal e^-i2pikn/N then Ouput fft should also be Spiral as you mentioned like Circles at different clock rate or frequency. But whenever we study the result we always use only magnitude that is square root of re^2 +Im^2 but what about phase. I always learnt while calculating Phase shift that cos and sin waves are propogating in the same axis but it is not true and we calculate the Phase angle by arctan(Im/Re) but this is only valid when we signal like this ( Acosx+B sinX= R sin(x+alpha) where alpha=arctan(B/A). As far i know about Fourier there are two theories and that makes me confuse. 1. It is the sum of Sinusoid. but we can also represent cosine as a phase shifted Sine so We can also represent as a sum of Sine and Cosine but only in one dimension and in Magnitude Plot we square root the real and Imaginary. 2. and we use Euler Formula then our fourier tranform becomes complex but still we use one dimesion for real and one dimension for Imaginary Part as aoutput frequency. I am confused in Phasor calculation because it is in 2 Dimension and sin and cosine are Propogatin in Orthogonal axis. How do we calucule Phase? and also what should i treat fft as 2 dimension or one dimension while studying the output result I have read so many books and articles but i am still confused about this thing. Can you help me?
Yes, however 90% of the time you break it into power (vector length) and phase (vector angle). Frequency power is what most care about and what I picture towards the end of the talk.
Can someone please explain what's happening at time=4minutes and 40 secs, There's the one dimension signal with varying amplitudes at each discreet moment in time. We imagine that we have a continuous such function. Here's where It gets confusing for me : There are three clocks below the linear signal. We are given that the rotational velocity of each data point is the same for all three clocks. The magnitude of the vectors correspond to the magnitude of the data at each time t. What do the three labels "signal mapped to frequency 1, then frequency two and final frequency three mean? What frequencies? It can't be the rotational velocity(frequency) because we're given that it's the same for all three clocks. We also see two vectors of the same magnitude in the first two clocks but out of phase(I think phase is used correctly here.) the third clock simply has a dot of the same distance from the center as the vector magnitudes, which, again, are the same magnitude. Many thanks. Joe
I will try to answer your question and I am assuming you are talking about 6:40 and not 4:40. The rotational velocities are exactly whats different. The fact that the dot in the 3 radial plots move at different frequencies can be seen purely from observation. Also, like you rightfully observed, the dots in the 3 radial plots have the same magnitude but are at different phase. This is also because of their rotational velocities being different. "We are given that the rotational velocity of each data point is the same for all three clocks." -This is whats causing the problem in your understanding. This hasn't been claimed or given. "What do the three labels "signal mapped to frequency 1, then frequency two and final frequency three mean? What frequencies?" -he is doing this to give an intuitive understanding of how wrapping a signal in a signal (expressed in the cartesian plot) in a radial plot at different frequency can give us information about the frequencies contained within the signal. You can also check out the video of youtuber 3Blue1Brown who uses this same method to give an intuitive understanding of fourier transforms. Heres the link: czcams.com/video/spUNpyF58BY/video.html Hope my answer helped clarify some confusions.


![[柴犬ASMR]曼玉Manyu&小白Bai 毛发护理Spa asmr](http://i.ytimg.com/vi/0TsXQ7z2Dh4/mqdefault.jpg)


This video did an FFT on my brain, increased power, and did the inverse FFT. Now I am transformed.
This is a comprehensive overview of discrete Fourier transform, thanks a lot.
Thank you so much for this presentation! It is by far the best explanation of FT I found on the internet. Great visuals and well-thought-of structure!
I'm a student to electrical engeneering on my 3rd year. Only now, AT THIS VERY MOMENT, thanks to this lecture, I truly understand Fourier Transform. Thanks!!! It has been occuping my mind many times.
yes... this is by far the simplest and clearest explanation of DST/FFT. something that is usually approached from a mathematical point of view instead of an intuitive one. i knew someone out there had thought of explaining this from an intuitive angle. i want to know more people like you. i am now following you on twitter. thanks for sharing
Probably the best explanation of the Fourier Transformation that I have ever seen.
this is remarkable. of all the videos on fourier transforms this is the only one that actually explained it in a meaningful way. watching this video, i understood how it worked before I even knew I did. i was like holy crap, i understand it.
William,
I loved your lecture. You have a clear, breezy style of speaking and some new things sank in for me. Thanks.
Brilliantly done! Indeed first video in youtube to explain the FFT ... INTUITIVELY, so the brain of mere mortal is able to comprehend! Thanks!
These animations do a great job of illustrating the operations hidden in the formulas. Aside from some errors here and there, this is nicely done!
I am a nurse practitioner in cardiology/electrophysiology. The Fast Fourier Transform is now being used to analyze the electrocardiograms of heart failure patients to help determine which patients might respond to therapies such as biventricular pacing. The initial results have been promising. THANK YOU FOR INCREASING MY UNDERSTANDING.
As a vibration engineer, I have spent my decades analysing machinery vibrations to detect machine faults. I have always defended use of this know how on human body, especially the cardiac system. In machinery we detect faults by observing deviation of vibration spectra from what is accepted as normal. I think, same could be applied to cardiac system to obtain the signature of a normal heart and compare patients' signature to it.
Excellent explanation!!! If you are confused by the "winding clock" description, please just realize that the "clock" is rapidly advancing thru MANY frequencies. Each measured frequency is a snapshot of that "clock". If you were to stop that clock, you would see the result for that one frequency (where you happened to stop). The Fourier Transform calculates the "mutual alignment" of all the circling data. Mostly, the alignment is poor and the value is low. When the circling data all converges to a specific unified shape, the resulting score is high. This means that the FFT result for that specific frequency also goes high. Furthermore, this means that that frequency is a partial component of your original data (heartbeat, tide distance, etc.)
After so many years thanks to you I finally understood how the FFT works .. Thank you very much..
Thank you so so much gallamine! I really needed an intuitive understanding of Fourier Transforms! This is great!
I am an engineer and though i am not directly into signal processing and FFT stuff, I do interact with other groups who do this. Tried to understand this to the core, but could not until i see this. Probably this is the way, one has to understand things, feeling fortunate to get across this video from vast signal processing videos available in the ocean of internet. Thanks a lot for posting this.
Sriram Sista
This is an amazing lecture. Explains the practical aspects of DFT and FFT so clearly and helps one to develop an intuitive understanding for them.
"Take the data and multiply it by circles" - THANK YOU!! Finally someone demystifies this horrendous looking equation :'D Great presentation, will have to watch back a few times.
and for laplace mutiply the circles with exponential functions (growing and decaying) as some systems may contain exponential growth and decay. pi models all types of circles whereas e models all types of growth/decay when you play with its exponent part (think about compound interests and the fact that the derivative of e is itself)
Excellent! I could never quite keep the details of FFT or its purpose in my head, because it was always so abstract. Now I'm stoked to use it to write a voice recognition script!
I really like this. I'm an older engineer who last had in-depth contact with Fourier Transforms decades ago. This is well done and not too mathy.
Thank you very, very much. You just made me understand this so well.
This is a beautiful illustration of how math can become so much more interesting when you view it geometrically. Thank you for sharing.
Great talk! The DFT is such an incredible tool! I'm halfway through, and wanted to mention that there are many times when the phase is EXTREMELY important in understanding your data (in many cases, the more important part of the data)... so not to think of it as something that should be 'disregarded' (around 17:30)... for example, look up X-Ray crystallography :)
Increased my understanding about Fourier Transforms and FFTs - thanks!
I have worked with fourier transform for some time. I have even made my own FFT program that actually worked. But I did't understand it completely until now. Thank you very much.
Fair enough!
Very helpful explaination for FFT (21:42). Thanks a ton ! You saved a lot of time.
This is the best illustration of how computers can help us visualize and understand mathematics better than math on a page. Thank you for sharing this great lecture.
Absolutely ! 2D/3D Visualization is the key and we should use more visualizations in schools and universities !
I am currently studying the characteristics of turbulence as computed using Large Eddy Simulation, in particular, the time history of turbulent fluctuations. I found this video extremely helpful in terms of how I can analyse my data. Thanks, and I feel lucky that I found this video!
I am still watching the video, I didn't finish it, but I must say even now that you described it very well! I understood everything to this point. Great work!
wow this was a brilliant presentation!
Really helpful - good structure, very depicted Explanation, great style of talking :)
Thank you for your effort!
Excellent teaching! I am a mechanical/manufacturing engineer and I have occasionally used FFTs without really understanding the details since it was not in my coursework. Your explanation makes sense. It has previously baffled me where the frequency measurements come from. This will help me to better understand the details of vibration analysis I am performing. As a fellow mandolin player, I also appreciate your use of a guitar in the description. Guitar is probably a bit more interesting with the over tones than the mando...
Despite some disconnects between the slides and the narration, and one mistake in the slides that had me really confused for a bit, this is probably the BEST intro to the FFT algorithm I've ever seen. Most devolve into abstract formulas and gloss over how they work.
I've known for a long time what FFTs do (even used them in my code), but they've always been a black box to me; I never really understood the concept behind them.
Thanks for posting this!
exactly. this is a very mechanical and practical explanation of what is actually happening.
what mistake did you find. it would be useful for the viewers if you mentioned it :)
What are the odds? I was looking for this type of explanation and i would have skipped the struggle to understand this topic 'INTUITIVELY' if it had kept me confused for more than 24 hours. Before I could google it or search here, I found this as a suggested video. This is an amazing lecture and I don't need to watch any other. I have now understood what i was looking to. Considering the complexity of this topic, We both cannot Imagine how much time of struggle I have saved after watching this lecture. Grateful to you and Google's AI.
Thanks for the kind words Shota. Good luck with the rest of your learnings!
Despite the couple of mistakes, this was a fantastic presentation. Thanks!
Great job William!
Thanks a lot, wonderful job, you really painted fft as a interesting story... i never understood after years of study fft...i am grateful
This is super helpful, thank you for making this video.
The vector explanation was great!
thank you. I was looking to understand this, and you made it simple for me.
I saved this video because it is priceless ! Big respect !
wonderful presentation and intuition. thanks a lot!
thank you this helped me understand the fft more than other explanations
Awesome explanation... teaching...
This is fantastic!
Nice video. It was always a little like witchcraft in the back of my mind, but I accepted it working with a leap of faith because it always did. I think you just taught it to the other half of my brain.
At 4:25
The angular frequency of hour hand, minute hand and second hand is so wrong.
The second hand takes 60 seconds to go around.
Thank you! I was so busting my brain and questioning if my memory of analog clock is wrong. hahah
Second hand - 2.pi.r / 60 seconds
Minute hand - 2.pi.r / 3600 seconds
Hour hand - 2.pi.r / 43200 seconds if it’s 12 hour clock or 2.pi.r / 86400 seconds if it’s 24 hour clock
Ha ha, bien vu ! 😄 I made the same calculations as Sundar and was checking in the comments if anybody had noticed this error before posting.
if only every teacher was like this!!!! great lecture
Excellent presentation, Thanks!
how i wish learn english properly, it seems a excelent presentation.
This is great, thank you
yay, 8th semester electrical engeneering and finally I understand the dft :)
Amazing talk. Really intuitive.
I think the Euler formula is the other way around exp(jx) = cos(x) + i*sin(x)
+ertyxtras doh! You're totally right. I'll get that fixed :)
+gallamine I've forgotten that I've written this comment; reading it again I see that I've used both engineering and physics notation for sqrt(-1) so it is quite easy to make these errors :) I've enjoyed the video a lot. Thanks for sharing!
+ertyxtras cos(x) - i*sin(x)
It's traditionally the sum, not a difference.
Note that technically one could write the Euler's formula as sin(x) + j cos(x). The only difference is you would start at (0,1) and rotate clockwise.
that triggers me sorry but not sorry
Hi,
one question that has intrigued me: why the need to overlap the the sample window when doing FFT on the fly on a signal ?
if we take the FFT on a sample and convert it back then there is no change in the signal (the output is exactly like the input);
if we take the FFT on a sample but modify in some way the output of the FFT (i.e. apply a filter of some sort) and then convert back into time domain, then at the beginning and the end of the same we get some kind of "chirps". Why ???
1) watch the section on window functions. Without a window function the signal-to-noise ratio isn't good.
2) The window function reduces the energy at the beginning and ending of the data window. The overlapping is so that an interesting bit in your signal wont be lost if it happens to be at the beginning or end of each window (due to the window function reducing the energy there).
@gallamine, can you point out some direction on how to "measure your energy or sleep and see if there are time cycles"? I got interested on that. Thanks. Very good video!
4:30 If I'm not making a mistake here - non-native English speaker -, what you'd call the hour hand of the clock is what moves around the circle in 12 hours' time (not 3600 s, which is an hour), the minute hand what moves around the circle in an hour's time (not 60 seconds, which is a minute), and the second hand what moves around the circle in a minute's time (not 1 s, which would be very fast).
Mewcancraft you are correct it’s a mistake. I thought I’d put overlay notes indicating this. Maybe they’ve been removed.
Why didn't I understand this when I was learning about FFT in college ... was I not paying attention, or was it not taught very well? I'll never know. Thanks for presenting it using these more intuitive concepts than the abstract way I was forced to learn it. I'm jealous of kids today who have the internet at their fingertips ... what an advantage when it comes to learning otherwise challenging concepts.
Thank youfor the video.
What is 2d FFT and how does it relate to velocity in radar measurements. And 1d FFT to range?
Wonderful lecture! But the audience would benefit if you’d introduce and distinguish between terms like frequency of sampling and frequency of the moving point
Best out there about Fourier Transform
Thanks for this video. Why does the circular plot at 10:54 look so different from the one at 8:54? Is it because you are using another data set here?
If not, please explain the mapping. I understand the rectangular graphs on the right on 10:54 (averages and vector magnitude), I just don't get how you get from the circular plot at 8:54 to the circular plot at 10:54.
+Rasmus Rønn Nielsen Great question! I didn't mention it as to not confuse people too much. I simply added a fixed-value offset to the plot in 10:54 - I did this so it was more easy to see the lines. That just means for each value I added a fixed number (like 10) to it to push it away from the origin. It doesn't actually change much at all - all of the averages will be raised by a fixed amount. This is also why, at the end of the talk, I mention that best practice is to remove the DC, or average, value of the entire signal before taking the FFT - it just makes things easier, but doesn't really change things much in the end.
Hi, thank you, this is amazing. I wish there was more resources out there like this. Can you tell me, is your technique of wrapping the signal round a circle and finding the 'centre of mass' different mathematically from the conventional Fourier Transform? From what I understand the convention formula is convolving the signal by sine and cosine waves that sweep through all frequencies. Is your circle that the signal wraps around the same thing as the sine and cosine in the formula?
+nicksworldofsynthesizers yes. The first several minutes of the presentation are showing how sine + cosine is a circle. The conventional presentation of the fourier transform is (in my opinion) designed for compactness, elegance, and convenience for giving engineering students homework problems.
+gallamine your animation has enabled me to visualise Fourier Transforms in my head. I can see how a bell curve is it's own FT just by stretching it round a circle. How hard would it be to do the equation in one's head. I would rather be a human with understanding than a robot with knowledge :)
The seconds hand takes 60 seconds, the minutes hand takes an 3600 seconds, and the hours hand takes 43200 seconds to rotate.
at 6:41, why negative length doesn't shift in 180 degrees on the plot of frequency 2 ?
any special meaning?
Bravo.Well done
Thanks for the video It would be much help for my project. Practical facts would be most helpful I think. cheers
Thanks a lot for this!!
Hi, thank you for this amazing video. I am not getting how the different frequencies are represented by different circles. I can see when we increase the frequency the "2D plot" spreads but I don't understand what changes in the circle when we change the frequency that makes the plot spread. Cause I think however fast we move (the minute hand moves), the spatial distance in 2D will remain the same with respect to Ts as it is the interval at which we're putting the 1D data on 2D plane!?! and by keeping the sample data and the radius of circle same arent we putting a limit on the Ts (the interval at which we plot in the 2D space)? and by different frequencies if we're sampling the 1D plot again at those frequencies shouldn't the 2D plot appear the same? :( Can you please explain how the circles are different with respect to frequencies? Do the frequencies determine the interval (angle spread) at which we plot the 1D points in 2D? Many thanks.
Awesome explanation
Can I have the slides for the presentation please ?
Thank you again for this helpful video
Thanks and great job
Great! Thank you so much!
How did you implement the animated figures?
I rendered images in python and then used ffmpeg to make the animations. Here's my repo: github.com/gallamine/fft_oscon/blob/master/OSCON%20Rev1.ipynb
Hey William!
Sorry for my late reaction and thanks for your quick answer!
I was kind of busy in the last weeks and didn't want to answer before I actually tried to replicate your work.
Now I did and it worked. Thanks !!
I didn't know about ffmpeg and I feel very grateful about your hint.
Thanks again, Flo
what is wrapping of a signal around a circle. when you mean vector do you mean freezing all the rotators and taking all x's and summing to get avg X ? and similarly y?
Excellent explanation! Just one question:
On the "Projecting onto the circle" slide (7:09) the time series signal gets projected onto the three circles with each circle having a vector with different angle speeds.
The sum of the vectors of the points on the circles determine the power that correspond with that angle speed (or frequency).
How did you determine / choose the speed at which the time series signal itself gets 'fed' into the circles? Does it correspond with the frequency sample?
If so is my assumption correct that sample frequency and sample length impose a limit on the lowest measurable frequency? (lowest freq = samples / frequency)
JRprofucktions in order to make sense of the data you need to keep some reference. This is usually the sample rate (F_s) which 1 over the time between samples (Ts). In the illustration at 7:09 there are 3 circles - each is rotating at 1, 2 and 3 times-per-second - or 1Hz, 2Hz and 3Hz respectively. The data is about 2.5 seconds long and was sampled at (I think) 100 Hz - or 100 samples every second (for a total of 250 samples). The data points are evenly distributed (in angle) around the clock face - i.e. the 1hz clock will have 100 samples distributed around it's perimeter.
The lowest measurable frequency is 0 Hz (no rotation, or the average of all the sample values). Frequencies below 1 Hz are fractional. Negative frequencies just indicate the clock is turning in the opposite direction and works out to be the same as the positive frequency value. The *highest* frequency is al little trickier - it's actually F_s/2.
Does that help?
gallamine I have tried to understand the mechanism by which these arms are deduced with no luck. I thought the third circle is the vector sum of both the first and second. Can you please elaborate in this point , how the arm lengths are estimated.
Muhammad Nada The three circles are independent. Three different rotation rates or frequencies. The arm length is the magnitude of the signal at the top - the value of the red dot. It isn't an estimate, I just make the arm length equal to the signal value at that time. The fact that the 3rd circle chart doesn't have a blue line drawn is just a mistake on my part. HTH.
Mr. Gallamine, thanks for the video... After 40 minutes reading through the comments, I think that what you said in this reply: "The data points are evenly distributed (in angle) around the clock face - i.e. the 1hz clock will have 100 samples distributed around it's perimeter." made a great deal of contribution to my understanding of what really means ""Projecting onto the circle". Thanks.
I think putting "The fact that the 3rd circle chart doesn't have a blue line drawn is just a mistake on my part." as a note on the video, would better help others to understand that slide.
love it!!
Am I crazy or did he mess up Euler's identity at 15:10. Shouldn't it be e^jx = cos(x) + jsin(x)? Since cos is real and sin is imaginary in rectangular form. If not, how is he able to switch the cos and sin?
lol he did mess that up
Yeah, sorry about that!
gallamine no problem, I just thought I missed something fundemental about that equation
@@siddharthbhonsle9514 0
how is the frequencies at which the wave is wound about the circle are determined ?
so how is a convulution and deconvulution used in wave forms?
Got to love the butterfly
Nice video!
at 6:42:
It's clear to me that the length of the arm represents the absolute value of the signal, but what does the angle represent? You say that "when the measurement is negative the clock arm switches direction" but that doesn't seem to be true.
If I understand correctly, the frequency attributed to each circle represents the frequency that the signal is being sampled. So I thought maybe the angle represents the phase of the sampling period (For example: a a sampling takes place every full cycle), but if that were the case then shouldn't each individual arm be moving at a constant rate? Because it is clear that the angular speed of each arm isn't constant, and I actually timed it and got that some cycles take twice as long than others. This shouldn't happen if the red dot is in fact moving at a constant (horizontal) speed.
Maybe I'm mistaken in the angle representation tho.
+rksilvergreen at that point in the presentation (slide titled Projecting onto the Circle) I'm showing what happens if you take 3 clocks at 3 fixed rotation rates and adjust the length of the "clock arms" to correspond to the measured signal. The angle of each clock arm is simply a factor of how fast they're rotating. One of the clocks is rotating once-per-second (1Hz). That means for a measured signal 3 seconds long, the clock will make 3 rotations. When the "signal value" is below zero, then the length of the clock hand is reversed (it flips 180 degrees).
So the actual angle the clock hand makes will be (clock_speed * measurement_time * 360 degrees). So, at time 0.5 seconds, a clock rotating at 1Hz will be at an angle 0.5*1*360 = 180 degrees.
Hope that helps! Don't be discouraged if you don't get this stuff right away. It took me a long time.
+gallamine Thanks for the answer.
Sorry if I'm being extremely ignorant here but:
a) I've actually timed each clock twice now and it I get very different cycle times for each clock (even for my crude human measurements). Might be a technical error.
b) You can take a snapshot at, for example, 7:04 when the signal value is 0.5 and 7:17 when the signal value is -0.5. If I understand you correctly then there should be a 180 degree shift for each arm, but if you look at clocks 1 and 3 (2 is borderline correct), there clearly isn't.
Plus, assuming the clocks are rotating at a constant rate, why would their angles correspond to the signal value?
I'm not trying to be petty but I just want to understand this correctly because it's the basis for the next slides :)
+rksilvergreen a) the three clocks shown on the "Projecting onto the Circle" slide are rotating at three different rates. This is why they're labeled - frequency 1, frequency 2 and frequency 3.
b) It seems we're talking past each other on this issue. All I can advise is to perhaps look at the code used to generate the plots (Cell 116 here nbviewer.ipython.org/github/gallamine/fft_oscon/blob/master/OSCON%20Rev1.ipynb). Also consider a polar plot - to draw a polar plot you chose and *angle* (clock_speed * measurement_time * 360 degrees) and you choose a *length* - that's the signal value at that time, which determines how far from the center of plot the line extends. When the measurement has a negative sign, the length is negative and is plotting extending the opposite direction.
Sorry I'm not able to make it more clear!
+gallamine Thanks for your time :)
Great video! Never thought the Fourier Transform could be so easy to understand! Is there also an intuitive way to understand the FFT algorithm? What is it that makes it fast? Which property does it exploit? Are some of the sin/cos calculations reused for multiple frequencies?
+Paul Paulson Jake VanderPlas has a great writeup on the algorithm and how it works: jakevdp.github.io/blog/2013/08/28/understanding-the-fft/
Oh, on 30th minute it sounds like the two strings are out of tune. It is nicely visible at the FFT plot at frequency around 45bins beating.
Hihi! Where can I find the python codes used for this seminar?
hi do you by any chance have any source's somewhere? (for the python code) not that it's alot of code :) I could just type it over. but just wondering, as a reference :)
All of the code is up on github.com/gallamine/fft_oscon
oh nice thank you so much ! :)
i don't understand why windowing improves things?
can someone give me a simple explaination of that?
how does cutting off the frequencies near the beginning and end help sharpen things up?
Excellent
Hi! Isn't exp(jx) = cosx + jsinx? I think you interchanged sine and cosine while explaining the Eulers identity.
Yes. I scrolled through the comments to see others that spotted that
what does the length of the averaged vector correspond to?
Ds Bach the energy of the signal at that frequency.
I have a clock and the hour hand takes 12 hours to make one revolution. Won't the angular speed of the hour hand be 2*pi/12X60X60 radians per second? See the 4:30 mark of the video.
Thanks.
Thanks my man
After watching a couple of videos about this topic on CZcams, this one is the most confusing one.
Can you elaborate on what you think he gets wrong?
I'd be interested to know which part is wrong about his video and the betterexplained page.
Agree lol.
Was good before 8:00, than after these weird blue loops appeared - got totally confusing
can you please link any better video? Thanks
Hellow.
I don't understand something.
Does the arm of the clock represent an absolute value of the signal?
When red dot is on value 1.0 or -1.0 for example the arm lenght is 1.0.
If so how the sign of the graf is tranlated in to the circle diagram?
Also at 7:39 you say" when the measurment is negative the clock hand switches directions" what does it mean?
A negative length is a shift in 180 degrees. Or, equivalently drawing the same length in the opposite direction
Dyda tom are the clock hands moving counterclockwise for a reason?
That is what confused me - watching the clock representation at about 6:42, no matter if the red dot is on +1 or -1, the middle clock is at approx. 135 degrees and the length of the clock arm is the same. No difference between -1 and +1.
Dyda tom the *absolute* value of the signal is the "hand" length. A signal of +1 and -1 both have a length of 1. What changes is the rotation - or phase - of the signal. + to - results in a rotation of 180 degrees.
Liam Cowden the rotation frequency - how quickly the hand is rotating - is what's causing that.
I wanna listen the lecture he got when he was an undergraduate
I am pretty sure this guy has never seen an analogue clock before. Shows the hands moving CCW, says that it takes the hour hand 360 seconds to make one complete revolution around the clock face, botches the speed of the minute and se one hands as well. I will seek out a different FT video now thank you very much.
I have never seen a clock. Tell me more.
I do not think the aim of this video is to explain in a deep way the
mathematics. It is only a 37 minutes video. For people who are
studying this and have spent a lot of time understanding mathematics but
are still struggling with the concept, this video is very good. I do
not mind if some calculus are wrong. Ideas are very well showed and
simulations are very helpful. I do not understand why people criticize
this.
Good job man
Did you find one that you liked better?
awesome
suggestion to rotate the images clock wise, since you are using that analogy Btw we called our Physics soccer team, the FFT's.
hi, you describe the x axis as the real axis and the y axis as imaginary. isn't imaginary more akin to the z axis? as in lateral numbers?
Say the sampling rate is 1Hz, is it possible to find frequency components more than 1Hz using FFT?
***** due to what's called "aliasing" information that's multiples of the 0.5*sampling_rate will be visible in the spectrum. This gets tricky because you know which multiple it is. Generally you will *first* filter the signal to remove high frequency information and then compute the FFT, but you can *bandpass* filter your signal first and then use a technique like undersampling to observe the frequency information of signals at much higher rates than your sample rate (en.wikipedia.org/wiki/Undersampling).
That said, for general sampling and frequency observation you'll need to sample at *twice the maximum frequency you want to observe.*
You are god!
Very nice explanation :-)I have one one major doubt. I know fft should be 2 dimensional because we are multiplyig the signal with spiral signal e^-i2pikn/N then Ouput fft should also be Spiral as you mentioned like Circles at different clock rate or frequency. But whenever we study the result we always use only magnitude that is square root of re^2 +Im^2 but what about phase. I always learnt while calculating Phase shift that cos and sin waves are propogating in the same axis but it is not true and we calculate the Phase angle by arctan(Im/Re) but this is only valid when we signal like this ( Acosx+B sinX= R sin(x+alpha) where alpha=arctan(B/A).
As far i know about Fourier there are two theories and that makes me confuse.
1. It is the sum of Sinusoid. but we can also represent cosine as a phase shifted Sine so We can also represent as a sum of Sine and Cosine but only in one dimension and in Magnitude Plot we square root the real and Imaginary.
2. and we use Euler Formula then our fourier tranform becomes complex but still we use one dimesion for real and one dimension for Imaginary Part as aoutput frequency.
I am confused in Phasor calculation because it is in 2 Dimension and sin and cosine are Propogatin in Orthogonal axis. How do we calucule Phase? and also what should i treat fft as 2 dimension or one dimension while studying the output result
I have read so many books and articles but i am still confused about this thing. Can you help me?
Yes, however 90% of the time you break it into power (vector length) and phase (vector angle). Frequency power is what most care about and what I picture towards the end of the talk.
Can someone please explain what's happening at time=4minutes and 40 secs, There's the one dimension signal with varying amplitudes at each discreet moment in time. We imagine that we have a continuous such function. Here's where It gets confusing for me : There are three clocks below the linear signal. We are given that the rotational velocity of each data point is the same for all three clocks. The magnitude of the vectors correspond to the magnitude of the data at each time t. What do the three labels "signal mapped to frequency 1, then frequency two and final frequency three mean? What frequencies? It can't be the rotational velocity(frequency) because we're given that it's the same for all three clocks.
We also see two vectors of the same magnitude in the first two clocks but out of phase(I think phase is used correctly here.) the third clock simply has a dot of the same distance from the center as the vector magnitudes, which, again, are the same magnitude. Many thanks. Joe
I will try to answer your question and I am assuming you are talking about 6:40 and not 4:40. The rotational velocities are exactly whats different. The fact that the dot in the 3 radial plots move at different frequencies can be seen purely from observation. Also, like you rightfully observed, the dots in the 3 radial plots have the same magnitude but are at different phase. This is also because of their rotational velocities being different.
"We are given that the rotational velocity of each data point is the same for all three clocks." -This is whats causing the problem in your understanding. This hasn't been claimed or given.
"What do the three labels "signal mapped to frequency 1, then frequency two and final frequency three mean? What frequencies?" -he is doing this to give an intuitive understanding of how wrapping a signal in a signal (expressed in the cartesian plot) in a radial plot at different frequency can give us information about the frequencies contained within the signal. You can also check out the video of youtuber 3Blue1Brown who uses this same method to give an intuitive understanding of fourier transforms. Heres the link: czcams.com/video/spUNpyF58BY/video.html
Hope my answer helped clarify some confusions.