Video není dostupné.
Omlouváme se.
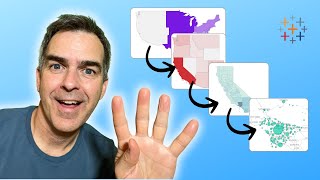
SUPER SIMPLE Hexbin Maps in Tableau

Vložit
- čas přidán 3. 07. 2022
- In this tip, I show you how I create a hexbin map in Tableau. But first, I explain the purpose, benefits and drawback of a hexbin map.
This video is going to help you communicate the concentration of data on maps more effectively and give you another option for visualizing geospatial data. I’ll show you how to create a hexbin map based on both the value and the rank, giving you two options depending on your use case.
00:01 Intro
00:25 The Problem
00:50 What is a hexbin map?
01:02 When to use a hexbin map
01:07 The problem with filled maps
01:20 The solution - hexbin maps
01:34 When to avoid hexbin maps
01:54 Examples of maps that don't show concentrations well
02:40 Tableau tip - Austin Bikes
06:15 Tableau tip - Prices by zip in the USA
Download the workbook - public.tableau.com/app/profil...
Data sources:
1. Austin Bike Accidents - bit.ly/AustinBikeAccidents
2. Austin Zip Codes Shapefile - bit.ly/AustinZipCodes
3. Price Summary - bit.ly/PriceSummary


Thanks for this straight forward explanation. I can see many uses for hexbin maps.
⚡Coming from a GIS background to BI analytics, I never imagined this was possible in Tableau :D Thank you for the awesome tutorial!
I was looking for this tip for a long time - very useful for me - thank you very much 😊 👍🏻
Your videos give a lot of inspiration.
Glad you like it 😊👍🏻
👏 great tutorial, thanks for sharing. I like this format with some introductory use case examples before diving into how to create them. And then it helped me remember the core stages in the process by having a second example too.
That’s great to hear. Thanks for the feedback. I’ll give it a go again next week.
A friend of mine directed me to your videos as a resource for Tableau and it was some of the best advice I've ever been given. Love learning from you! Thank you! 🙂
Great to hear!
👏 Amazing tutorial ! Thanks for sharing this to the community
I feel much more comfortable in Tableau after following your tips Andy☺️. Thanks for sharing such amazing techniques and explaining so nicely. Respect from India 👍
Thanks for the support Prany! 👍🏻
🌎I run a lot of Tableau geospatial training sessions and never knew Hexbining was this easy! Thanks Andy! Can't wait to incorporate this into my training sessions 🗺
Have fun!
Your content is great and easy to follow. Thank you for this tutorial. 🙂
You're very welcome!😊
👏🎯Great tip, just what I needed!
Glad it was helpful!
Awesome tutorial! Just finished basics of Tableau and jumped into your channel. Its super useful. Thank you so much.
Great to hear!
❤ Great video as always!
❤️
❤🔥 The best tutorials out there!
Glad you like them!
I never thought Hexbin Map would be so easy and the concept before creating it was really helpful... Thanks, Andy again for the informative video. If you can incorporate these 'when to use and when not to use ' segment for all your videos it will be really helpful... 🙂❄
Thank you 👍🏻
🔥 awesome , made it to the end
Woohoo! 🔥
👍Great video, thanks for sharing your knowledge!
Thanks Michael 👍🏻
❤ clear and concise! 🙏
Thanks!!
🙂 very cool, Andy!
Thanks! 🙂
🤫 awesome explanation 👏
Thank you Mohammad! 🤫
great work really helpful
Glad to hear that!
👏 great video. Thanks @andy
My pleasure! 👏🏻
"👌👌"
As always, thank you for another gem!
My pleasure! 👌🏻
Great Tutorial! Thanks a lot
You're welcome!
👋Thanks Andy, never thought to use hex bins before this.
No problem 👋🏻
Best as usual.
Glad you think so! Thanks!
This is great! thanks 👌
👌
Andy, great video. 😎would love to hear a discussion of this method where you have an original set of lat,lon data versus when you create a hex map using a self defined set of coordinates (like when you want a map of the US with AK and HI nearby) would like to hear more about each of these cases.
😎 good question! I see them as different use cases. In the latter, you are predefining the location of each mark. The hexbin method allows you to be more prescriptive with how any marks you show and it also put the marks closer to where they truly are geographically.
🎯 thank you
🎯
Good to find out how to use that feature.
Excellent! Learning new things is what I love! 🥡 I can’t find that emoji so I’ll give you some takeout noodles. 😊
:) well done as usual
Thanks Michel 😊
Awesome! 🤩🛑🤩
Thanks!! 🤩🛑🤩
👍 Great
Thanks!! 👍🏻
Thanks for explaining the usage do’s and don’ts in the beginning of the video Andy!
I am working on analyzing and visualizing our Home and Auto insurance customer retention based on the premium by on CBSA. I am going to try this out and send you a screen capture 🤩
Do you have this workbook on Tableau Public? I was going to download shapes from it. ☺️
Thanks for pointing that out. I've added it to the description. Here you go - public.tableau.com/app/profile/andy.kriebel/viz/HowtoCreateaHexbinMapinTableau/Title
Hi Andy,
Thanks for the video, its super helpful! I tried using the same methodology to create my hexbin map.
But I ran into some problems after using hexbins.
(1) I tried to filter a crosstab using filter actions (by selecting the hexbins on hexbin map worksheet) , it resulted in having null values in a separate crosstab (for some of the hexbins) . If i display the same measures as the crosstab as tooltip in the hexbin map worksheet, all the measures will appear without errors.
(2) Using the same action filter , I tried to perform a LOD calculation using hex bin x and hex bin y. The LOD calculations return unexpected numbers.
Not sure if you encounter similar issues before?
👌👌👌
🔥
🔥
Great to learn this Andy..could u plz tell what is the Adjuster parameter doing here or could u just tell on that
The parameter allows you to adjust the number of hexagons so that you can get it to look the way you’d like.
Ok got..@@vizwiz thanks👍👍
👍🏻👍🏻
Does it work if the Latt and Long are system generated? Or only if they are native in the data?
Native to the data. You can’t use tableau’s automatically generated fields in calculations.
I’d like to learn how to create a coxcomb chart that can be used to show how different parts of a category make up a whole. Thank you 😊
I have never built one, but here are two methods from some of my Data School consultants.
www.thedataschool.co.uk/gwilym-lockwood/coxcomb-charts-alteryx-tableau-one-stop-blog-shop/
m.czcams.com/video/iFQMefl1vII/video.html
❤️
❤️
🏆
🏆
👍👍
🤩
🙏🏼
🙏🏻
👍🏻👍🏻👍🏻
👍🏻👍🏻👍🏻
❤️🙏🏻👍
❤️🙏🏻👍🏻
Andy, where do you get your custom shapes from?
I tend to get there on this website. jrgraphix.net/r/Unicode/25A0-25FF
🙌
👌
👌🏻
🧐 is it possible to build these using an other known geographic identity like postal code (Zipcode) which doesn't have an X or Y?
🧐 you must have lat/lon in the data set. However, if you put zip code on your map, select all records in the view, export the data, you get the lat/lon of each zip code.
Thanks for the video, but how to generate longtitude and latitude attribute? My data source doesn't have these two attributes. thanks
You need them to use this for geographic data. It’s also possible to do this with a scatterplot.
@@vizwiz Thank you. I will figure out alternatives.
😉👍
😉👍🏻
👋🏻
⭐
⭐️⭐️
🙂🔥
🙂🔥
😊😍
😊😍
😎cool
😎
@@vizwiz I really enjoy your content and I’m so fortunate you share your tableau knowledge.
@@stevenh1195 thank you!
❤😊😮
What if Longitude and Latitude are not already on the dataset and are automatically generated by Tableau? I want to visualize a global map but I can't find any shape file.
Unfortunately those built in lat/lon cannot be used in calculations.
🤠
🤠
👍🏻
👍🏻
🙏
🙏🏻
👍
👍🏻
could you please share the steps from the beginning to create Hexabin Map in Tableau.
The steps are in the video.
@@vizwiz Thank you so much.
😊
😊
💡
💡
😎
😎
👏✊️🙏😊
👏🏻✊🏻🙏🏻😊
🤚
🤚
😊
❇
✨
😊😊😊
😊😊😊
🥞
🥞
:)🥳😜
👍🏻
:)
😊
😀
😀
😉
😉
🙂
🙂
📣
📣
🤓
you know each other? 🙂
🤔
🤔
hex emoji
⬢
🦾
💪🏻
🤩
🤩
❤
❤️
👍👍
👍🏻👍🏻
👋🏻
👍
👍🏻
👍🏻
👍🏻
🐥
😊
😀
😄
:)
😊
🤓
🤓
🤩
🤩
❤
❤️
👋🏻
👍
👍
👍
👍🏻
👍
👍🏻