Population pyramid

Vložit
- čas přidán 1. 11. 2020
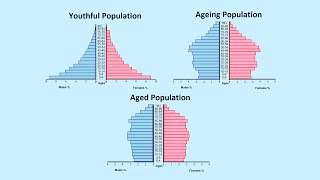
- Explanation of population pyramids and the three types of population pyramids: expansive, stationary and constrictive.
Full text:
The characteristics of the population can differ between countries. In some countries there are mainly a lot of old people, while in other countries the population consists of a lot of young people. This video explains how to compare the population of countries with a population pyramid, which is also called a population diagram. The population of the Netherlands is used as an example.
First we divide the total population of more than 17 million people into 2 groups; men and women. Then we divide the population into age groups of 5 years: we have an age group for people from 0-4 years, 5-9 years 10-14 years and so on. There are 444,000 boys aged 0-4 years and 422,000 girls aged 0-4 years. We can add the numbers for each age group.
Dividing the population over age groups in this way is called a population structure.
Now we can also graph the size of each group. We make a bar for each age group. On the left we make a bar for the men. In the age group 0-4 years this bar thus comes to 444,000. On the right we make a bar for the women. In the age group 0-4 years this bar comes to 422,000. We can do this for all age groups. In this way a population diagram of the Netherlands is created. The shape of this population diagram gives us a lot of information about a country.
There are countries which have a very broad bottom. This means that there are many children living in the country. People often have many children, so that children can take care of their parents later, for example.
Often the size decreases rapidly in subsequent age groups. This often means that some of the children die young, otherwise the other age groups would have been slightly larger. The older the age group, the smaller the group generally is. Eventually a kind of pyramid shape is created where there are a lot of children, but few people get old. This pyramid shape is characteristic of the population structure in poor countries and is called an expansive pyramid: the population is growing.
When a country develops, its population diagram changes. Economic development makes a country richer. Children are less needed to care for parents, girls go to school longer and therefore have their first child later, and contraceptives become available, resulting in fewer children. So the younger age groups are getting smaller.
Economic development causes health care to improve, resulting in a lower deaths rate. The difference between the age groups is getting smaller. Ultimately, the population diagram changes and is indicative of the population structure in countries that have already undergone significant economic development. This is a stationary population pyramid, since it’s population is not growing.
If economic development continues, fewer children will be born, while the group of older people will actually grow. An constrictive pyramid is formed. This could become a problem in the future: because few people are born and the population size decreases, there will be too few people who can work.
This demographic pressure can also be read from the population structure. This is the ratio between the working population and the inactive part of the population.
The group of people between the ages of 20 and 65 is seen as an active part of the population. This group generally works and therefore pays more taxes. A large part of the group under the age of 20 goes to school and therefore costs the government money. The group over 65 receives a pension and makes extensive use of healthcare and therefore also costs the government money.
It is often the case that in poor countries, where the population diagram looks like a pyramid shape, there are many young people and the green pressure is high. In rich countries, where there is a constrictive pyramid, there are many elderly people and the gray pressure is high.
In short; a population pyramid helps you to quickly get an impression of the population structure and thus also gives an indication of the economic development of a country.


i missed a 1 hour lecture on Population pyramid. And you covered it in 4 minutes. thanks. Thank you.
20x better than my teacher!!! Tysm
you teach this better than my teachers thank you
Good video 😊
Great video :D
Yup
Its really helpful
When we read an age-sex pyramid of a country, how may we know the status of women, level of economic development, and possible location in the world? For the status of women, do fewer women across all ages mean lower status? For the level of economic development, does the progressive pyramid mean lower economic development, the intermediate pyramid mean more developed (higher level), and the regressive mean developed (the highest level)? For the location, does progressive mean African countries, intermediate mean Asian countries, and regressive mean Western European and North America? Thank you
VERY GOOD VIDEO IT HELPED ME A LOT IN MY ONLINE PRESENTATION ASSINGEMENT
CAN YOU PLEASE REPLY FOR MY COMMENT
THANK YOU