Introduction to IR Spectroscopy: How to Read an Infrared Spectroscopy Graph

Vložit
- čas přidán 10. 05. 2020
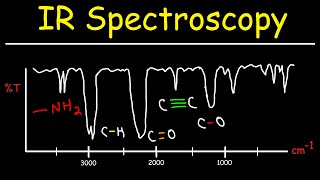
- In this video I will give you an introduction to infrared spectroscopy and explain what the graphs mean and how to interpret a spectroscopy graph. This is pitched at the level of A level and AS chemistry but can be used beyond that. I will show you how to interpret the peaks on the graph to work out what functional groups are present in a substance and explain the significance of the fingerprint region of an IR spectrum.
Link to Infrared spectroscopy correlation tableen.wikipedia.org/wiki/Infrare...


I am taking this instrumental chemistry class and had to analyze some FTIR data. The professor does not know how to explain the information, but with the level of explanation in this video, I got the help I needed. Thank you!!
I was so stressed about my assignment but this explains it so clearly thank you so much !
You had my loyalty at "What the hell does this complete mess mean?"....and your British accent of course 😅😂
😂😂😂true
*Scottish
Same here
Currently watching this at 02:49 in the morning writing a lab report on the enantioselective reduction of a ketone to a chiral alcohol and im in the data and analysis section and i have absolutely no idea how tf to read these and i appreciate your existence
You have saved my life! Thank you so much for this video, it was amazing and so much easier to follow than my university lectures!
I watched few other videos, but found this explanation the best. Thank you.
Thank you so much for this explanation. Simple and easy to understand.
Thank you so much sir, I wish if teacher like you there in my college no one is going to fail in subjects.🙏🙏
Well damn! I don't need to go to the stuck up post doc now. Thanks a bunch!
Thank you so much, I have been trying to learn about this in lecture and through reading the lab manual, but I did not make any headway until watching this super helpful video.
This is actually much of help than university lectures...
Thank you so so so so so so much, this is the best explanation I've seen of an IR spec chart, thank you!!
This video was very much helpful. Thank you!
That was extremely useful! Thanks a lot for your clear explanation😌
very informative and light video to watch, thank you very much for that
This video really helps me for analysis my FT-IR data, thanks
Perfect explanation!! Thank you
Clear and concise!
Thanks for helpful video on FTIR graph interpretation.
This video was very helpful!!!
Thank you so much. You just helped me!😊
Very useful video! Thank you so much!
Thank you for this good useful video, I have learned a lot through the clip. More power
Thank you so much!!! It's brilliant... Amazingly done
Glad it helped you. Took ages to make!
Thank you so much!!! Now I finally get it, but I was about to give up until I found your video
Hi
thank you for the intro. I was wondering what if we have a mixture of ethanoic acid and propanol. Will the alcohol peak disappear under a huge O-H hump?
Very well explained.
Thank you so much for this video! Keep up the good work man
Very informative piece, watching from Kenya.
Thank you so much!
This explaination make me helpful.
Thank you so much, it really helped me
Thank you. This video was very helpful.
Thanks. Glad it helped.
Yes it is very informative. Thank you
Thank you for sharing your knowledge sir! You sound so familiar.
thank you so much for clearing my doubts.
Really now i realized that how basic peak identification can be carried out
you are a great person, thanks
Thanks for this precise information
Thank you so much, this helped me prepare my presentation
Good explanation, thanks alot
Very helpful for a non-major newbies like me.
Lol
Great lecture thanks
Great explanation
very nicely explained
Thanks for the video.
Thank you! you saved my life
omg finally gets it. thanksss from Brazilll
Thanks. I wonder how air contents and atmospheric condition be taken into account when analyzing object in space or up in sky when air constanly shifting
The video was very helpful but still quite confused about the fingerprint region.
Thank you so much 🙂🙏🏼
Why was this recommended to me AFTER my exam? :c
I only JUST passed.
I have a table of wavelength values? They cant be used for IR right?
how do you interpetate the transmittance? like, if I make a IR graph with a molecule, how do I know how much transmittance every peak is?
very helpful video .. tysm!!!!
I was looking at how to read the FTIR spectrum and saw this video, click with no expectation BUT I love how it goes so far. The start was a good tell: What the hell does this complete mess mean? HAHA Thanks, uploader!
New favorite channel
Thank you!
Very nice explanation.
Thank you. Much appreciated.
THANK YOU SO MUCHH im not in chemistry background but when doing project in biomedical field, i have to use FTIR for my samples and i dont understand a thing to read these graphs. This helps alott thank uu. Now how do i read the fingerprint region? or does it not matter to be discussed in scientific paper?
Had u explained active an inactive ir region
Thanks!
Excellent thank you
Very helpful
Thanks for your detailed explanation. Yet, may I know why we cannot use the fingerprint region to identify a compound if it is unique? Why are we required to identify all the functonal groups of a respective molecule so as to distinguish the compound in exams instead? thanks a lot
So that you are able to interpret the data at a glance. It’s useful in reaction monitoring, quality control, forensics, etc. The fingerprint region is not easily memorized.
The fingerprint has to many peak which makes it difficult to identify a compound.
realy thank you.
Please how can I identify the interpretation for an aqueous extract of ginger and solid dispersion formulation of ginger extract?
Dude thankyou!! this is exactly what i needed to see
I'm glad you found this helpful.
I have a question. Are we supposed to separate the diagnostic and fingerprint region from the 1500 wavenumber every time or do we have a trick to know from where we should be separating those regions?
Same question.you got the answer?
400-1500 cm-1 are finger print region range
Best video ever
good one
When you can't find stuff on Google, CZcams is your best bet. I'm doing an experiment in class and this IR spectrum is impossible to find online. Thank you for the great explaination.
Good explanation
Thanks
Very useful... Thanks 👍🏼
Thank you
thank you
Thanks mob
We had like a 12 hour lecture about this topic and I had no idea what the f*** was even going on until I watched this video. Thank you
unfortunately, my peaks are very very narrow I couldn't interpret what they are. Any suggestions?
In my graphs, there are no peaks above 1500, what should I interpret from that?
What is the reason for the broadness and narrowness of the peaks?
Can any one tell me about absorption peak and stretching bond in FTIR ??
Holy you really do have everything in here bahaha
Weldone
Interpretation of spectrum is always tactical
Is technique of reading ir and ftir same?
How the 2nd spectra will be ester??
how do you know it is propanol and ethanoic acid?
@everyone i am getting peaks at 360 cm^-1 ..for my AL doped PbS quantum dot......what do i infer from that...? Pls anyone help me out 🙏🙏
how do you know if it’s ethnaoic or propanol why not like propanoic
hey this group team can you advice me good book for learning spektrascopy
You try to give the video more brightness it will be great if you do
10/10
anyone possibly know what the compound is from the infrared spectrum shown before propanol??? :)
😊😊😊😊
Had to watch 3 videos before this one, the first one being straight from my professor, to finally understand. Talking about bonds and shit but no one bothered to say how to actually be able to read them
Can you please do a chick fil a interview question and answer
Great idea. Done: czcams.com/video/eBJm2q6YExY/video.html
"what the hell does this complete mess mean" INSTANT THUMBS UP...because my sentiments exactly 😂
Miss Chee & the gang; do U REMEMBER me?
دعيلي ندي مليح عندي ايكزاما بعد أقل من ساعتين
Anyone here from USYD pharmacy?
Wth I thought it was benzoic acid .. how come it's ethanoic acid ???.. can someone please explain me 😭😭😭😭😭.. I need to learn IR for my end semester exam