If we use 5-15 PCs, then how do we represent all of these dimensions visually? I understand that with 2-3 dimensions we can put the data onto a single graph, so with this number of dimensions would we have to draw out many different graphs during the analysis stage? How would we present all of these dimensions in a research project?
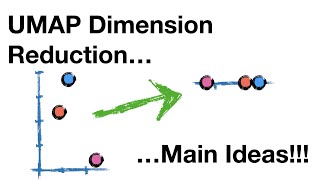
Or do we put the large amount (5-15) of PCs into t-SNE and UMAP to further reduce dimensionality until we are able to create one singular 2-D graph (2 dimensions)?
You got it right! Chipster (and the corresponding Seurat vignettes) give you few different plots for estimating the (true) dimensionality of the data, i.e. how many PCs to use for the next steps of the analysis. These plots usually show one or two components at once, and for example the heatmaps are plotted for first 12 PCs by default (you can tune this). I suppose it would be enough to show some of the plots to justify the choice for the number of PCs. So PCA is step 1 in reducing the dimensions, so that clustering step won't take for ever and struggle with the excess of information. Different plots showing the PCs are there to help you to choose the number of PCs you want to continue the analysis with: whether it's 10, or 15, or 50 first principal components. After clustering, tSNE and UMAP are used for visualisation: to really show the data in 2D (step 2 in dimension reduction).
Of course you can, excellent questions! Those plots are from Chipster (chipster.csc.fi), but the codes within are pretty much directly from Seurat, so you can check the R-commands for example from here: satijalab.org/seurat/articles/pbmc3k_tutorial.html The heatmaps for the PCs show the "extreme" cells on the x-axis and "extreme" genes on y. They are "extreme" in their PCA scores, so those genes that basically best determine that particular principal component, i.e. the separation between the cells. Similarly for the cells: these cells "furthest away" (in the yellow or purple end) from each other on this spectrum of PC1. So what one might want to eye-ball with these plots is whether the genes reveal what that particular PC might be all about: for example, if the genes seem to be related to cell-cycle phase, one might want to consider regressing out that effect, or at least it's good to acknowledge this.
Thank you for letting us know! We borrowed two tSNE slides from Paulo Czarnewski's presentation (nbisweden.github.io/excelerate-scRNAseq/session-dim-reduction/lecture_dimensionality_reduction.pdf) as indicated, but we were not aware that one of them was originally from StatQuest. We will add that info now in the slide and also in the description of the video.
All the Chipster tool scripts are available in our GitHub repository (see for example: github.com/chipster/chipster-tools/blob/master/tools/ngs/R/single-cell-seurat-pca-v3.R). I would also like to recommend the excellent course material including the hands-on examples in R (titled "labs") of our R-based course! You can find all the material for those here: github.com/NBISweden/excelerate-scRNAseq


i'm biologist and now i get the main idea of this topic :) thanks a lot for this, now i have to move to the explanation of Paulo about tSNE and UMAP
Wonderful! Yes, Paulo's explanations are truly excellent!
great job keep on posting such videos
If we use 5-15 PCs, then how do we represent all of these dimensions visually? I understand that with 2-3 dimensions we can put the data onto a single graph, so with this number of dimensions would we have to draw out many different graphs during the analysis stage? How would we present all of these dimensions in a research project?
Or do we put the large amount (5-15) of PCs into t-SNE and UMAP to further reduce dimensionality until we are able to create one singular 2-D graph (2 dimensions)?
You got it right! Chipster (and the corresponding Seurat vignettes) give you few different plots for estimating the (true) dimensionality of the data, i.e. how many PCs to use for the next steps of the analysis. These plots usually show one or two components at once, and for example the heatmaps are plotted for first 12 PCs by default (you can tune this). I suppose it would be enough to show some of the plots to justify the choice for the number of PCs.
So PCA is step 1 in reducing the dimensions, so that clustering step won't take for ever and struggle with the excess of information. Different plots showing the PCs are there to help you to choose the number of PCs you want to continue the analysis with: whether it's 10, or 15, or 50 first principal components. After clustering, tSNE and UMAP are used for visualisation: to really show the data in 2D (step 2 in dimension reduction).
@@ChipsterTutorials Thank you so much!! Your guides are so helpful for beginners like me :)
Can I ask how did you draw the heatmap for each PC, what is exactly shown in the heatmap each PC ? I am really confused. Thank you a lot.
Of course you can, excellent questions! Those plots are from Chipster (chipster.csc.fi), but the codes within are pretty much directly from Seurat, so you can check the R-commands for example from here: satijalab.org/seurat/articles/pbmc3k_tutorial.html
The heatmaps for the PCs show the "extreme" cells on the x-axis and "extreme" genes on y. They are "extreme" in their PCA scores, so those genes that basically best determine that particular principal component, i.e. the separation between the cells. Similarly for the cells: these cells "furthest away" (in the yellow or purple end) from each other on this spectrum of PC1.
So what one might want to eye-ball with these plots is whether the genes reveal what that particular PC might be all about: for example, if the genes seem to be related to cell-cycle phase, one might want to consider regressing out that effect, or at least it's good to acknowledge this.
You took that tSNE slide from StatQuest
Thank you for letting us know! We borrowed two tSNE slides from Paulo Czarnewski's presentation (nbisweden.github.io/excelerate-scRNAseq/session-dim-reduction/lecture_dimensionality_reduction.pdf) as indicated, but we were not aware that one of them was originally from StatQuest. We will add that info now in the slide and also in the description of the video.
Can I get your code, for the entire purpose?
All the Chipster tool scripts are available in our GitHub repository (see for example: github.com/chipster/chipster-tools/blob/master/tools/ngs/R/single-cell-seurat-pca-v3.R). I would also like to recommend the excellent course material including the hands-on examples in R (titled "labs") of our R-based course! You can find all the material for those here: github.com/NBISweden/excelerate-scRNAseq