
- 580
- 5 525 912
Indzara - Simple and Effective Templates
United States
Registrace 25. 12. 2012
Indzara.com provides 150+ free & premium high-quality Excel, Google Sheet and PowerBI templates covering areas of Small Business Management, HR, Project Management, Data Visualization, Finance Management, Stock Market, Calendars and more.
My name is Dinesh Natarajan Mohan. I believe that simple tools can lead to effective solutions.
These simple templates are designed to help us make smarter decisions, save time by automating manual tasks and eliminate human errors by leveraging computers. You will also save money by using our free and affordable premium templates.
Our philosophy is SIMPLE and EFFECTIVE.
This channel will have videos about templates as well as How-to videos about Excel. If you have any questions about Excel and would like us to post a solution as video, please post it as a comment.
We sincerely hope the solutions are helpful and look forward to your feedback. Please Subscribe to this channel to be notified of future videos.
Statistical Process Control Charts in Excel
Discover how Control Charts, also known as Statistical Process Control (SPC) charts, can revolutionize your business process monitoring. These powerful tools help you determine if your processes are operating within control by analyzing various metrics.
Whether you're in eCommerce, manufacturing, finance, or IT, SPC charts can provide valuable insights. For instance, in eCommerce, measure order fulfillment efficiency, track failed orders, assess upsell effectiveness, and monitor product return rates. In manufacturing, keep an eye on product dimensions, while in finance, track billing attempts. For IT, evaluate the number of bugs and missed project deadlines. Learn how SPC charts can enhance your process control and drive improvements.
To know more about this go through our detailed blog here: indzara.com/statistical-process-control-chart-excel-template/
******************************************************************************
Are you looking for a quick, instant chart-maker template where you can enter just data and have charts readily created for you?
Check our latest product, the Instant Chart Maker from our Data Visualization Toolkit in Excel: indzara.com/product/data-visualization-excel-templates/data-visualization-toolkit/
******************************************************************************
For more such tutorials, visit indzara.com/datatodecisions/
#excelmadeeasy #exceltips #excelchartstutorial #exceltricks #datavisualization #spccharts #spc
zhlédnutí: 89
Video


How to Create a Box and Whisker Plot Chart in Excel?
zhlédnutí 146Před měsícem
Discover how to create a Box and Whisker plot in Excel to analyze salary distributions across different departments in your organization. Learn the concepts, key components of the plot, formulas available in Microsoft Excel, sample plots and many more covered in this video. This video includes step-by-step instructions for creating and formatting your chart for clear visual appeal. Read more ab...

Client Testimonial: Retail Business Manager Pro
zhlédnutí 50Před měsícem
Download our Simple and effective Retail Business Manager Pro today. The Retail Business Manager (Pro) is suited for managing inventory and sales if you are running a retail business of buying products from suppliers and selling to customers. You can manage inventory at multiple warehouse locations using this template. Download the #excel version here 👇🏽 indzara.com/product/retail-inventory-and...

Master Resource Management with Our Free Excel Capacity Calculator Template
zhlédnutí 469Před 2 měsíci
Are you struggling to align projects with your available workforce? Our free Excel Capacity Calculator Template is the ultimate solution for efficient resource management and project planning. This tool transforms how you can handle resource allocation, ensuring productivity, meeting deadlines, and fostering growth. 📈 Who Needs This Calculator and Why? • HR professionals aligning talent with ta...
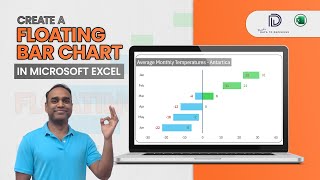
Floating Bar Charts in Excel: Step-by-Step Tutorial!
zhlédnutí 134Před 2 měsíci
Welcome to the latest video from #datatodecisions In this video, we'll look at the steps to create a simple floating bar chart that can handle both negative and positive values in your data. This video guides you through setting up your data and creating visually appealing floating bar charts that are perfect for highlighting changes and comparisons over time. Enhance your data visualization sk...

Creating Tornado Charts for Sensitivity Analysis in Excel
zhlédnutí 133Před 2 měsíci
Welcome to yet another video from #datatodecisions. Our in-depth tutorial on creating Tornado Charts for Sensitivity Analysis in Excel enhances your data analysis skills. In this video, we demonstrate how to create a Tornado chart, specifically for performing sensitivity analysis. This tutorial is perfect for project managers, financial analysts, and anyone looking to make data-driven decisions...

Tornado Charts in Excel: For Only Positive Values Explained!
zhlédnutí 121Před 2 měsíci
Unlock the power of Tornado Charts in Excel with our detailed tutorial focusing on scenarios where only positive values are considered. In this comprehensive video from the #datatodecisions series, we guide you step-by-step through creating a Tornado Chart, also called as a Butterfly chart to visually compare data across different categories. This chart is perfect where there are two dimensions...

Excel Quick Tutorial: Data Labels in Column Chart
zhlédnutí 90Před 2 měsíci
In this video from the #datatodecisions, discover how to add and customize data labels in Excel column charts with this quick tutorial. In this video, you'll learn how to display data labels to show the corresponding values directly on your columns and how to format them. Data labels provide clarity and context to your charts, making them more informative and actionable. For a detailed guide on...

How to Create Bar within a Bar Chart in Excel?
zhlédnutí 119Před 2 měsíci
Welcome to the #datatodecisions series where we’ll tackle day-to-day Excel problems and scenarios, one video at a time! Today’s video is all about creating bar within a bar chart, which can be used to uniquely represent target vs. achieved for each series of data. Learn the simplest method to create this unique chart and amp up your presentations! Are you looking for a quick, instant chart-make...
Formatting Gridlines in a Excel Column Chart
zhlédnutí 37Před 2 měsíci
In this quick video from the #datatodecisions series, we'll learn how to add and customize gridlines in Excel column charts. With this video, you'll discover how to adjust gridline color and ensure the visibility, clarity, and readability of your charts. Gridlines help guide the viewer's eyes across data points, making your charts more professional and easy to interpret. For a comprehensive gui...
How to Format the Plot Area Fill Colour in Column Chart?
zhlédnutí 21Před 2 měsíci
In this video from our #datatodecisions series, discover how to customize the plot area fill color in Excel column charts. With this tutorial, you'll learn to differentiate between chart area and plot area and how to format the plot area fill color to enhance the visual appeal and clarity of your charts. A well-chosen fill color can make your data stand out and improve the overall readability. ...
How to format the Chart Area Fill Colour of a Column Chart
zhlédnutí 35Před 2 měsíci
Welcome to yet another video from #datatodecisions. In today's video, learn how to customize the chart area fill color in Excel column charts. In just a couple of minutes, you'll discover how changing the fill color can improve the overall look and feel of your charts, making them more visually appealing and easier to read. If you are looking for a detailed tutorial on all the key formatting el...
Colour of Column in Column Chart | Excel Quick Tutorial
zhlédnutí 43Před 2 měsíci
Welcome to the latest video from the #datatodecisions series where, in the last few videos, we are looking at formatting the key elements of a #columnchart. In this video, discover how to customize the color of the columns. In just a few minutes, you'll learn how to change the colors to enhance the visual appeal and readability of your charts. Choosing the right colors can help you highlight ke...
How to Format a Y Axis Start in an Excel Column Chart Easily?
zhlédnutí 40Před 2 měsíci
Welcome to the latest video from #datatodecisions Learn how to set and customize the Y-axis starting point in Excel column charts with this quick tutorial. In just a couple of minutes, you'll discover how adjusting the Y-axis start can improve the accuracy and readability of your data presentation. This small tweak can make a significant difference in how your data is perceived. In this video, ...
Excel Tips: Learn to Format the Legends in Column Chart
zhlédnutí 42Před 2 měsíci
Welcome to another video from #datatodecisions. In under a couple of minutes, you'll learn how to add, customize, and position legends to make your charts more informative and visually appealing. Legends play a crucial role in identifying different data series and enhancing the overall readability of your charts. With this video, learn why legends are important and how to format effectively. Fo...
Format a Column Chart in Excel: The X-Axis Title
zhlédnutí 30Před 2 měsíci
Format a Column Chart in Excel: The X-Axis Title
How to Format Y Axis Title in an Excel Column Chart?
zhlédnutí 80Před 2 měsíci
How to Format Y Axis Title in an Excel Column Chart?
Excel Quick Tutorial: Format Chart Title in Column Chart
zhlédnutí 62Před 2 měsíci
Excel Quick Tutorial: Format Chart Title in Column Chart
Create Custom 100% Stacked Bar Charts with Totals in Excel - Quick Tutorial!
zhlédnutí 85Před 3 měsíci
Create Custom 100% Stacked Bar Charts with Totals in Excel - Quick Tutorial!
Creating 100% Stacked Bar Charts Made Simple!
zhlédnutí 65Před 3 měsíci
Creating 100% Stacked Bar Charts Made Simple!
Enhance Your Stacked Bar Charts with Totals in Excel
zhlédnutí 44Před 3 měsíci
Enhance Your Stacked Bar Charts with Totals in Excel
Create Impressive Stacked Bar Charts in Excel - Easy Tutorial!
zhlédnutí 55Před 3 měsíci
Create Impressive Stacked Bar Charts in Excel - Easy Tutorial!
Create Multi-Series Bar Charts in Excel - Easy Guide!
zhlédnutí 46Před 3 měsíci
Create Multi-Series Bar Charts in Excel - Easy Guide!
Excel Bar Chart Tutorial: From Beginner to Pro in Minutes!
zhlédnutí 64Před 3 měsíci
Excel Bar Chart Tutorial: From Beginner to Pro in Minutes!
Quick Excel Charts: Creating 100% Stacked Column Charts
zhlédnutí 34Před 3 měsíci
Quick Excel Charts: Creating 100% Stacked Column Charts
Instant Excel Tutorial: Creating Waterfall Charts
zhlédnutí 38Před 3 měsíci
Instant Excel Tutorial: Creating Waterfall Charts
Instant Charts: Creating Simple Stacked Column Charts
zhlédnutí 30Před 3 měsíci
Instant Charts: Creating Simple Stacked Column Charts
Excel Tutorial: Creating Dumbbell Charts
zhlédnutí 118Před 3 měsíci
Excel Tutorial: Creating Dumbbell Charts
Quick Excel Charts: Creating 100% Stacked Column Charts with Totals
zhlédnutí 70Před 3 měsíci
Quick Excel Charts: Creating 100% Stacked Column Charts with Totals
Instant Excel Charts: Small Multiple Column Chart
zhlédnutí 64Před 3 měsíci
Instant Excel Charts: Small Multiple Column Chart
Please share the template download link
Thank you for showing interest in our template. Following is the template download link for quick reference: indzara.com/free-excel-template-for-recruitment-tracker/ Best wishes.
Comment gérer des comptes avec des devises différentes?
Thank you for showing interest in our template. We can add helper columns to convert the currency to a single currency. For example We can add two new columns. 1 - Transaction Amount 2. Conversion rate In the existing transaction amount column, you can enter a formula that multiplies transaction amount with conversion rate. Best wishes.
@@indzara Thank you for you quick reply.
So far this tutorial has been wonderful. I am stuck at 17:28 in the video. When I select the 42 square and then put in edit mode I press control, Enter but all it does is add a line to my formula. It does not populate the ## signs that you show. What am I doing wrong? Thank you!
Thank you for watching our video and sharing your valuable feedback. We regret the inconvenience caused. 1. You need to ensure you are selecting from cell B5 and the cell B5 has formulas. 2. Then you need to enter edit mode by pressing F2 key (Some keyboards required Fn key + F2 Key) 3. Then you need to press CTRL+Enter. You can also use CTRL+D and CTR+R separately after selecting the cell range B5 to H10 to duplicate the formula present in cell B5. Best wishes.
Hi, great video. Will the template still work if I copy the tab and change the ticker to a different stock? I've tired and whist the stock name and price is updated, the graph does not. I'm wondering if the data model is designed to only handle one stock at a time and not multiple tabs with different tickers? Thanks again for an awesome product.
Thank you for showing interest in our template and sharing your valuable feedback. Currently, the template is designed to show one ticker symbol at a time. The chart is populated from the data present in the hidden sheet. We have premium version of Stock Screener template where you can get 25 technical indicators signal and value for multiple ticker symbols: indzara.com/product/stock-market-excel-templates/stock-screener-excel-template/ Best wishes.
Sir, instead of typing stock names every time, can v create a list of stocks and then in front each stock names show the rsi values ? For example creating a list of nifty 50, nifty next 50 nitty 250 etc. Please help
Yes, we can use a Macro to automatically change the ticker symbol from the list in the template to get the RSI value and update it in the symbols table. We have done the same in our premium version of the technical indicator template that provides 25 technical indicator values along with RSI. Following is the link to the template for quick reference: indzara.com/product/stock-market-excel-templates/stock-screener-excel-template/ Best wishes.
How to increase the number of stages ?
Thank you for showing interest in our template. Adding additional stage involves lot of steps and formula level changes. We can take it as a customization project for a fee. Please reach out to us at the below link for estimation: support.indzara.com/support/tickets/new Best wishes.
do you have template about option tread Strike with Price Option by Excel Sheet operation Delta and Gamma others Greek thanks
Thank you for sharing your requirement. No, we use Excel stock datatype to get stock data from Microsoft Database and currently Option trading data such as option chains, strike prices, expiration dates, implied volatility, or other specific options metrics are not available with Microsoft Stock Datatype. Best wishes.
@@indzara thanks can you specific strike ATM the last 5 minuets
@@openmindjustdoit1306 No, currently we do not have the dataset to calculate and get the last 5 minutes strike ATM. We take customization projects for a fee. If you have the dataset, please share the same at the below link for estimation: support.indzara.com/support/tickets/new Best wishes.
It's very helpful.... There are very less number of people are genuine in this industry..
I’m glad you found it helpful. Thanks for the kind words. It means a lot to hear that. Best wishes.
Thank you. very helpful
You are welcome. We are glad our video was helpful. Best wishes.
Hi do you have tiktok?
No, currently we are not available in TikTok platform. Best wishes.
@@indzara ok i found the channel that i have question about on youtube i will put the link below My question do you think he make the chart on excel or maybe he just use trading tool? czcams.com/video/Yxcb0TsSjZI/video.htmlsi=KnGHWhfjYpLSP58P
Excellent work! Thanks for sharing and explaining in such a nice way
Thank you for sharing your valuable feedback. You are welcome. Best wishes.
Thank you very much
You are welcome. Best wishes.
Hi, I would like to suggest you to modify this template , which can be used by NSE Indian stock market. Please try.
Thank you. The template works for all exchanges supported by Microsoft including NSE. If there are any issues, please let us know and we will be happy to address. Best wishes.
I can't thank you more ❤
my order sheet doesn't work properly, it seems that doesn't recognize other tabs, what should I do?
Thank you for showing interest in our template. We regret the inconvenience caused. I am unable to replicate an issue on the orders page from my end. Hence, please share your copy of the template with sample data and some screenshots highlighting your concern at the below link to replicate check further from our end: support.indzara.com/support/tickets/new Best wishes.
Can you add a quotation sheet linked asset sheet. Please
Thank you for showing interest in our template. Yes our premium version of the template will have option to generate a invoice from the orders sheet. You can change the title invoice to quotation to print it as a quotation. Following is the link to the template for quick reference: indzara.com/product/inventory-management-excel-templates/rental-inventory-sales-manager-excel-template/ Best wishes.
@@indzara thank you, Does this usable on cellphone?
@@Frsz-Sifiso_Xulu Yes, we use simple excel formulas to populate the reports, hence it will be functional on Mobile Phone Excel applications as well. You can also upload the template to Microsoft OneDrive and use the template from Mobile or any Browser. Best wishes.
Hi I have purchased this is just wondering how the Retention rate is calculated
Thank you for purchasing the template. Following support article contains the details on how the Retention Rate and Turnover rate is calculated in our Template: support.indzara.com/support/solutions/articles/62000214232-how-the-retention-rate-and-the-turnover-rate-is-calculated-on-the-retention-dashboard- Best wishes.
Love the video and the excel, the only problem I am having is with the Stage section, for some reason that formula was not working for me.
Thank you for showing interest in our template and sharing your valuable feedback. Please share your copy of the template with sample data and some screenshots highlighting your concern at the below link and we will be glad to assist you: support.indzara.com/support/tickets/new Best wishes.
czcams.com/video/XfSxsdgmpmA/video.htmlsi=NspENcjulAHXfL16 Is tarah se future stocks ka oi data from UDIFF bhavcopy,,,, If possible please make a detailed video Thank you so much
Hello sir FnO UDIFF bhavcopy zip file se, EOD Data from UDIFF bhavcopy zip file se,% 1 day highest change in open intrest,1day change in price, kaise Excel sheet me laya jayega, please detailed video banao thank you,08/07/2024 se NSE site ne kuch changes Kiya hai,,,,
Thank you for sharing your requirements. We have made a note of your requirements and will update you when we create a video solving your requirements. In the meantime, we have multiple stock market template that supports NSE. You will have full access to the template. The password to unprotect the sheet is indzara. Following is the link to the template for quick reference: indzara.com/stock-market-excel-templates/ Best wishes.
@@indzara czcams.com/video/5svR6e97OCQ/video.htmlsi=rTf5dUWaXtMUA-pD pls make a detailed video help of this idea
❤❤
Thank you for sharing your valuable feedback. Best wishes.
@@indzara Thanks
How did you create sales dashboard for these data. Help me with steps.
Thank you for showing interest in our template. Currently, we do not have a tutorial video on how to build the template. We will update you once we release a tutorial video on how to build the template. In the mean time you can also purchase the template at the below link and go through the calculations. You will have full access to the template on purchasing the template: indzara.com/product/small-business-excel-templates/sales-pipeline-manager-excel-template/ Best wishes.
Can you add links
If you are referring to event links, you will need to use HYPERLINK function to pas the event values in a different cell. If this is not your query, please share more details about your query to assist further. Best wishes.
And if someone doesn’t have Office 365 subscription then can they still use this template ?
Thank you for showing interest in our template. If you do not have Excel 365 subscription, you can use our Google Sheets version of the template. Following is the link to the template for quick reference: indzara.com/stock-portfolio-tracker-google-sheets-template/ Note: Make a copy of the template to your Google Drive to gain Edit access. Best wishes.
Big guy I downloaded this template and when I opened it there was no data as seen in the video. Additionally if I want to change any value in a cell like the time-offset it is password protected then how can I use it ?
We regret the inconvenience caused. The template requires an Excel 365 subscription to get the stock data from Microsoft Server. If you do not have an Excel 365 subscription, you can use our Google Sheets version of the template available at the below link: indzara.com/stock-portfolio-tracker-google-sheets-template/ Best wishes.
I was looking for a simple excel template to manage and track my stock trades. And found your template simple enough for a novice like me to use. I’ll give it shot today. Thanks a Million Bro for sharing this knowledge for free which most people don’t do !
Thank you for showing interest in our template. We are glad that you like our template. You are welcome. Best wishes.
You describe well about the formula of Simple moving average On cell F14(Avg.Gain) and on cell G14(Avg.Loss). In excel Simple average is "average" formula. But technically skipped about the average formulas of Cell F15 and Cell G15 (Which most people fail to understand). No one can understand why you use different types of average formula on Cell F15 and Cell G15 if you not describe well. You must have to say that, The formula of RSI is based on Exponential Moving Average. This is why on Cell F15 and Cell G15 we need to input the formula of Exponential Moving Average. Many may have a question that why the formula of "Exponential Moving Average" not input on the Cell F14 and Cell G14 directly. The answer is, No one can calculate "Exponential Moving Average" on the very first day. On the very first day "Exponential Moving Average" is unknown to all. This is why to calculate "Exponential Moving Average" we use simple moving average for the first time only.
Yes, you are correct. Thank you very much for your valuable feedback and input shared. We have noted it down and we will update the description in the next version of the template.
Its very Useful, Thank you👍
Thank you for showing interest in our template. We are glad our template was useful. You are welcome. Best wishes.
Hi experts. So I need to create a spreadsheet to rank 122 branches based on percentage achieved ranked on a scale of 1- 5. However, the tricky part is that the formula has to include 2 hurdles placed. So branches which score 97.0% - 98.4% will score a 3.0 - 3.9 respectively, and branches scoring 98.5% will score a 4.0 upwards, with the top percentile scoring a 5. It's not you basic 1-5 scale because of those conditions
Thank you for reaching out to us. The following are the steps to solve your requirements. 1. Create 2 sheets, 1 HELP and another sheet named DATA 2. The DATA Sheet has Data Table with Column A Branch, Column B Score %, Column C has Score % converted to a number and rounded to 1 digit decimal (=ROUND([@[Score %]]*100,1)), Column D Rank 3. In the HELP sheet, paste the below formula on the respective cells: On Cell A1 =ROUND(LET(min, MIN(DATA!$C$2:$C$15), SEQUENCE((97 - min)*10,,min,0.1)),1) On cell B1: =ROUND(SEQUENCE(COUNTA(A1#),,1,2/(COUNTA(A1#))),1) On cell C1: =ROUND(SEQUENCE(15,,97,0.1),1) On cell D1: =ROUND(SEQUENCE(15,,3,1/16),1) On cell E1: =ROUND(SEQUENCE((MAX(DATA!$C$2:$C$15)-98.5)*10+1,,98.5,0.1),1) On cell F1: =ROUND(SEQUENCE(COUNTA(E1#),,4,1/(COUNTA(E1#)-1)),1) On cell G1: =VSTACK(A1#,C1#,E1#) On cell H1: =VSTACK(B1#,D1#,F1#) 4. After this rank column D in the DATA sheet: =XLOOKUP([@Score],HELP!$G$1#,HELP!$H$1#,"") The minimum score will have rank 1 and the max score will have rank 5 with the mentioned condition. Hope this answers your requirements. Best wishes.
How to customise the settings sheet as per company requirements in a free template which is not premium pls help
Thank you for showing interest in our template. You will have access to modify the settings sheet as per your company policy on our free templates. If you are facing any difficulties, please write to us at the below link and we will be glad to assist you: support.indzara.com/support/tickets/new Best wishes.
I need this kind of file bro in Cars Rental please show me how to do thanks
Following is the direct download link to the template file: indzara.com/wp-content/uploads/2016/08/Rental_Inventory_Tracker_V1.xlsx You will have full access to the template to explore the formulas used. The password to unprotect the sheet is indzara. Best wishes.
how about the codes you didnt show
Thank you for showing interest in our template. Currently, we do not have a tutorial video on how to build the template. We will update you when we release tutorial videos. You can download the template from the below link: indzara.com/free-excel-template-for-rental-business-inventory/ Best wishes.
Hi! I just downloaded template and entered data. The fields are within the data but still the output tabs are not updating even after clicking refresh. In employee ID field I entered the last name. Is that ok? I also submitted a ticket just now with the spreadsheet. I am working on something time sensitive for work so your help would be appreciated. Thank you!
Thanks for downloading. Please email file or screenshots to us at support@indzara.com. we will review and get back to you as soon as possible. Thanks.
Our step by step guide is available here support.indzara.com/support/solutions/articles/62000152528-employee-retention-dashboard-excel-step-by-step-user-guide
@@indzara hello I submitted ticket through the website with the spreadsheet attached
Thanks. I have replied to the email. The reason is the 'date columns' which should be in date format that Excel expects. Otherwise, Excel treats it as text and all the calculations do not work as intended. Please review and let us know if any questions. Thanks. Best wishes.
Your videos are very helpful! Thank you!
Thank you very much. Great explanation and this was much needed for me.
You are welcome. Thank you for sharing your valuable feedback. We are glad that our video was helpful. Best wishes.
How do you set a color when the stock breaks the 52wk high or 52wk low
If you are referring to a chart, we will have three columns, 1 for neutral, 1 for 52 wk high and 1 for 52 wk low. When the price hits any of the mark, we will mark other two as NA in the formula. If you are referring to highlighting the value with the color, we use conditional formatting with a helper column that indicates, its neutral or 52wk high or 52 wk low. You can reach us with sample data at the below link to assist further: support.indzara.com/support/tickets/new Best wishes.
Very well done. Thank you for sharing us an excellent way of comparing lists. I sometimes have very large datasets and this a more intelligent way to outline differences without loading the source data to memory.
Thank you for sharing your valuable feedback. You are welcome. Best wishes.
is there a version that calculates COGs? I would like to see margins on my products and how each product performs.
Thank you for showing interest in our template. Yes, our premium version of the template has the requested feature. Following is the link to the same for quick reference: indzara.com/product/inventory-management-excel-templates/manufacturing-inventory-sales-manager-excel-template/ Best wishes.
thakyou so much!!! This material is very usefull, congratulations! This help-me in my job, thanks
You are welcome. We are glad that our video was helpful. Thank you for sharing your valuable feedback. Best wishes.
Suppose, data is of more than 10000 rows and having 50 different categories like tech, bank, etc. How to plot bubble chart? It there any simple method other than this way? Thank you, this method is also helpful.
You are welcome. Thank you for sharing your valuable feedback. Currently, different series of data cannot be added to the chart dynamically. Hence it has to be manually done for 50 different categories. However the same could be possible using Macros but currently we do not have a ready-made solution for the same. Best wishes.
Hi very helpfull video, how can I download this excel template?
Thank you for showing interest in our template. You can purchase the template from the below link: indzara.com/product/hr-templates/retention-dashboard/ Best wishes.
This is just blew my mind. Never knew this was possible on MS Excel. However, I've got a question; what happens if the dataset is expanded and broken down into months. Can this balances be carried forward into the next month. Also, can month slicers be applied?
Thank you. Please send sample data to support@indzara.com. We can provide a video solution. Thanks. Best wishes.
♥♥♥♥♥♥♥♥♥
Thank you for sharing your valuable feedback. Best wishes.
Hey Sir very useful information in the video, amm i have a question, how do ypu recomend tu update the data as de actual skill of the employees or the trainings that each employee needs to take or de mode of the training etc? What do you think is the easiest way to obtain this information considering it is a large and constantly changing database, so that it doesn't have to be done manually? Greetings! :)
I am glad that our video was useful. If the skill and training data is already available in the database we can use power query to import the data directly to Power BI or Excel. So that you do not have to enter data manually into the template. We take customization projects for a fee. You can reach out to us at the below link for free estimation: support.indzara.com/support/tickets/new Best wishes.
Does anyone know what the time period for the average volume is?
Daily average volume typically calculated over a period such as 30 days, 50 days, 90 days, or 200 days. For example, the 30-day average volume is the average daily volume over the past 30 trading days. Best wishes.
Do you have any with Kanban board incorporated into the sales pipeline file?
Currently, we have Kanban board incorporated with our Task Manager template. We have not yet integrated with Sales Pipeline Manager template. Following is the link to the templates for quick reference: 1. Free Kanban Board Template: indzara.com/kanban-board-task-tracker-excel-template/ 2. Task Manager Premium template with Kanban Board: indzara.com/product/project-management-excel-templates/task-manager-advanced/ Best wishes.
This is great and impactful, but am not familiar with power BI, how can i have the knowledge or learn, also download it
Thank you for showing interest in our template and sharing your valuable feedback. You can purchase the template from the below link and we also have Excel and Google Sheets version of the template available. You can look at the Excel and Google Sheet version of the template from the same link: indzara.com/product/hr-templates/performance-dashboard-power-bi-template/ But currently, we do not have a tutorial videos on developing Power BI templates. We will update you once we publish new videos on Power BI. Best wishes.
How can you pull in stock index data, like the Russell 1000/2000/3000? Using ETFs ax proxy isnt working as they dont track the chsnges identically. 😊
In excel, you can enter Russell and select Stock Datatype from Data ribbon to get the list of Russell stock ETF ticker symbols. You can select the appropriate ticker symbol to get the data. If this is not your concern, please share more details about your concern at the below link to assist further: support.indzara.com/support/tickets/new Best wishes.
I want the index data. The etf data is not matching the index returns and my indicators dont signal when etf are used. I saw that you had index data on your spreadsheet but i am now assuming you were usin
We regret the inconvenience caused. Can you share some screenshots highlighting your concern at the below link to check further from our end? support.indzara.com/support/tickets/new Best wishes.
That's great. Just been given an assignment. It's great listening to you.
Thank you for sharing your valuable feedback. Best wishes.
Sir can you send excel with formula I can pay you Plssss
Thank you for showing interest in our template. You can download the Excel template for free of cost from the below link: indzara.com/free-excel-template-for-rsi-technical-indicator/ We also take customization projects for a fee. You can write to us at the below link for free estimation: support.indzara.com/support/tickets/new Best wishes.
Sir how to connect you
Thank you for reaching out to us. You can write to us at the below link and we will get back to you within 1 business days: support.indzara.com/support/tickets/new Best wishes.