
- 48
- 40 204
Tech Solutions
Pakistan
Registrace 18. 05. 2021
"Welcome to Tech Solutions! 🖥️
Dive into the fascinating world of technology with our bite-sized computer videos. Whether you're a tech enthusiast, a beginner looking to learn, or just curious about the latest in computing, our channel has something for you. Explore quick tutorials, insightful tips, and the latest updates on everything from software to hardware.
Join us on this tech journey and stay updated with the fast-paced world of computers. Don't forget to hit that subscribe button and ring the notification bell so you never miss a moment of tech magic! 💻✨
Let's geek out together! 💡 #TechSimplified #ComputerShortVideos"
Impressive McKinsey Chart in Excel
🚀 Unlock the Power of Data with McKinsey-Style Charts in Excel! 📊
Ever wondered how McKinsey creates those stunning charts that make data look so compelling? In this video, we'll walk you through the steps to create an impressive McKinsey-style chart using Excel. Whether you're a business professional, analyst, or just a data enthusiast, you'll learn tips and tricks to elevate your charting game. From design principles to advanced Excel features, we’ve got you covered. Don’t miss out-watch now and transform your data presentations!
🔔 Subscribe for more insights and tutorials!
zhlédnutí: 58
Video
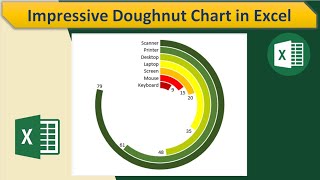

Impressive Doughnut Chart in Excel
zhlédnutí 613Před 21 dnem
Unlock the power of Excel with our step-by-step tutorial on creating a Impressive Doughnut Chart in Excel. In this video, you'll learn how to visualize your data in a dynamic and visually appealing way using Excel's powerful charting tools. Whether you're looking to enhance your presentations or improve your data analysis skills, this guide is perfect for Excel enthusiasts of all levels. Don't ...

3D Column Cylinder Container Chart in Excel Vid 2
zhlédnutí 333Před měsícem
Unlock the power of Excel with our step-by-step tutorial on creating a 3D Column Cylinder Container Chart! In this video, you'll learn how to visualize your data in a dynamic and visually appealing way using Excel's powerful charting tools. Whether you're looking to enhance your presentations or improve your data analysis skills, this guide is perfect for Excel enthusiasts of all levels. Don't ...

Item Wise Sales & Profit Dashboard in Excel
zhlédnutí 2,9KPřed měsícem
Unlock the power of data visualization with our comprehensive guide to creating an "Item Wise Sales & Profit Dashboard in Excel." Learn step-by-step how to track sales and profit for each item, analyze trends, and make informed business decisions. Perfect for beginners and advanced Excel users alike. Transform your raw data into actionable insights with this easy-to-follow tutorial. Subscribe f...

Profit Margin Table in Excel
zhlédnutí 442Před 2 měsíci
In this video, we walk you through the process of creating a profit margin table in Excel. Whether you're a beginner or looking to refine your Excel skills, this tutorial covers everything you need to know. Learn how to calculate and format profit margins, design an easy-to-read table, and utilize Excel formulas to automate your calculations. Boost your business analysis and decision-making wit...

Beautiful Customized Bar Chart in Excel
zhlédnutí 306Před 2 měsíci
Learn how to create stunning and personalized bar charts in Excel with this step-by-step tutorial! Whether you're a beginner or looking to refine your Excel skills, this video covers everything from basic chart creation to advanced customization techniques. Make your data visually appealing and impress your audience with professional-looking charts. Don't forget to like, share, and subscribe fo...

Interactive & Dynamic Dashboard using Pivot Table, Slicer, Doughnut Chart, Line Chart and Bar Chart
zhlédnutí 3,4KPřed 3 měsíci
"Unlock the Power of Data with an Interactive & Dynamic Dashboard in Excel! 📊💻 Dive into this step-by-step tutorial where we guide you through creating an impressive dashboard that brings your data to life. Learn how to visualize trends, analyze insights, and customize your dashboard for maximum impact. Whether you're a beginner or seasoned Excel user, this video will elevate your data presenta...

Create MoM (Month on Month) Trend using Line Chart in Excel
zhlédnutí 2KPřed 3 měsíci
Create MoM (Month on Month) Trend using Line Chart in Excel

How to create target Vs achievement bar chart in excel
zhlédnutí 2,1KPřed 4 měsíci
How to create target Vs achievement bar chart in excel
How to create Target Achievement Doughnut Chart in Excel
zhlédnutí 5KPřed 4 měsíci
How to create Target Achievement Doughnut Chart in Excel
Filter the data with basic pivot table techniques in excel
zhlédnutí 106Před 5 měsíci
Filter the data with basic pivot table techniques in excel
Comparative Analysis with Doughnut and 2D Bar Chart in Excel
zhlédnutí 618Před 5 měsíci
Comparative Analysis with Doughnut and 2D Bar Chart in Excel
How to make interactive and dynamic speedometer Gauge Chart in excel
zhlédnutí 654Před 6 měsíci
How to make interactive and dynamic speedometer Gauge Chart in excel
How to highlight maximum value in dynamic line chart in excel
zhlédnutí 101Před 7 měsíci
How to highlight maximum value in dynamic line chart in excel
How to make dynamic and interactive dashboard in excel.
zhlédnutí 334Před 7 měsíci
How to make dynamic and interactive dashboard in excel.
How to highlight the rows based on values in excel
zhlédnutí 13Před 8 měsíci
How to highlight the rows based on values in excel
How to assign scoring criteria in excel
zhlédnutí 23Před 8 měsíci
How to assign scoring criteria in excel
Generate printable item wise report with single click in excel
zhlédnutí 31Před 8 měsíci
Generate printable item wise report with single click in excel
Unlock Excel's potential 3 easy VLOOKUP techniques
zhlédnutí 13Před 8 měsíci
Unlock Excel's potential 3 easy VLOOKUP techniques
Boost Your Excel Skills with SUMIFS Function and Dropdown Filter
zhlédnutí 26Před 9 měsíci
Boost Your Excel Skills with SUMIFS Function and Dropdown Filter
How to joint text from different cell in excel
zhlédnutí 82Před 9 měsíci
How to joint text from different cell in excel
How to save multiple contacts in phone
zhlédnutí 76Před 11 měsíci
How to save multiple contacts in phone
Learning a lot from this thanks Lets learn people
no tutorial sound just annoying and loud music
Can you please share the File
Please find link in description.
❤
❤
When I copy the slicer and chart from the previous document to the document, why can the slicer and chart no longer be connected to the pivot table in the previous document? what do I have to do?
i mean from the previous document to the new document
Document file should be the same.
@@TechSolutions247 but the one you are using is like a different new document, how do you do it? sorry I'm a beginner
Sheets are different but document file is same
@@TechSolutions247 aaahh... ok thanks 👍
Your content is good... BUT ur music is ilegal for education purposes. Are you in the war? 😂
😐
😂😂😂😂😂😂😂😂😂😂
data file is not there
Data file link in description
can you upload excel file?
Data file link in description
@@TechSolutions247 link not working
Could we get one with a talk through?
Yes please..
Where is data set
Link in description
@@TechSolutions24718:39
data set please
Link in description
Data set please
Link in description
Charts become a work of art. Shows information presentation skills are as important as reporting out on data. 👍
Amazing
Thanks
Amazing. Just what I needed. Thank you.
very grateful
Great job, Can you share this file
Good tip
link to download excell template
Thank you
Nice work. Is it possible for you to share this for free?
Explained