
- 212
- 3 360 212
Absent Data
Registrace 11. 01. 2016
Channel is dedicated to providing you with quick and easy tutorials to expand your skills in Data Analysis Learn practical formulas in Statistics, DAX, Python, Excel and acquire Machine Learning techniques that will make you become a amazing data analyst.
End-to-End Data Analysis Project 2024 | SQL & Power BI | Beginner Friendly
You will build an end-to-end data analysis project in less an 1 hour. This is aimed at beginners who want to understand the whole end-to-end process of data analysis. It will help you develop skills and see a typical analysis request.
You are the Data Analyst in this Story:
You will act as a data analyst helping Toman Bike Share to understand if increasing prices next year is possible. All files and data provided. Here is the workflow below
1. Build a Database
2. Develop SQL queries
3. Connect Power BI to your database
4. Build a Dashboard
5. Make Analysis Recommendations
You can find all the files here for download
github.com/Gaelim/YT_bike_share
click the data file and download it as raw file.
Video Time Stamps:
0:49 Data Analysis Request Email
2:01 Downloading and Install Microsoft SQL Server and SQL Server Studio
5:22 Setting up your Database and Tables
10:25 Developing your SQL queries
22:43 Dashboard Preview
23:49 Connect Power BI to the Database
27:44 Building the Dashboard
55:05 Answer the Analysis Question
1:00 Recommending Price Increase
Check me out on Linked In or DM me:
www.linkedin.com/in/gaelimholland
For up to 50% at DataCamp, check out my affiliate link:
datacamp.pxf.io/KjO5ba
zhlédnutí: 88 162
Video
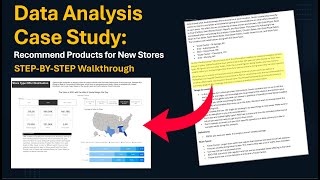

Data Analysis Case Study | Product Recommendation | Fortune 100 Company
zhlédnutí 4,2KPřed 4 měsíci
This is a full case study where you will be doing a full end to end data analysis using Excel, Power Query and Power BI. The problem statement asks us to create an analysis to discover what product mix should be recommended for the new stores. #datanalysis #excel #powerbi 0:59 Case Study Breakdown 4:27 Data Exploration 8:20 Cleaning Data with Power Query 12:43 Create columns 19:10 Grouping Data...

Dynamically Highlight HIGH/LOW, MIN/MAX with DAX | Power BI
zhlédnutí 1,2KPřed 4 měsíci
Learn to quickly highlight values, tables, charts, and more with some simple DAX in Power BI. You will learn how to use MINXX, MAXX, HIGH/LOW and AVERAGEX with the ALL function to work magic in data. 1:40 Create DAX Highlighter Calculation for MIN/MAX 8:00 Add Highlight to Visuals 9:53 High/Low Highlighter #powerbi #dataanalysis #datascience

Power BI & Machine Learning Dashboards | Full Course (2024)
zhlédnutí 7KPřed 6 měsíci
Power BI & Machine Learning Dashboards | Full Course (2024)

Data Analysis End-to-End Project | Google Cloud End-to-End Project
zhlédnutí 7KPřed 7 měsíci
Data Analysis End-to-End Project | Google Cloud End-to-End Project

SURPRISE RESULTS: 1,400 Data Analyst Job Openings
zhlédnutí 2,1KPřed 7 měsíci
SURPRISE RESULTS: 1,400 Data Analyst Job Openings

Python for Data Analysts - Data Cleaning, Transformation, and Analysis
zhlédnutí 4,3KPřed 9 měsíci
Python for Data Analysts - Data Cleaning, Transformation, and Analysis

Step by Step Power BI Dashboard Build -- Part 2 of End-to-End Project
zhlédnutí 2,7KPřed 9 měsíci
Step by Step Power BI Dashboard Build Part 2 of End-to-End Project

Tableau Beginner Tutorial | Full End to End Project (2024)
zhlédnutí 2,9KPřed 11 měsíci
Tableau Beginner Tutorial | Full End to End Project (2024)
Data Analysis Portfolio Project # 3 | End-to-End SQL to Dashboard
zhlédnutí 38KPřed rokem
Data Analysis Portfolio Project # 3 | End-to-End SQL to Dashboard
What Do Data Analysts REALLY Do? - Data Analyst Myths Debunked
zhlédnutí 2KPřed rokem
What Do Data Analysts REALLY Do? - Data Analyst Myths Debunked
Revenue Analysis: Geometric Mean, Growth Rate & Forecasting | Eps #4
zhlédnutí 3,5KPřed rokem
Revenue Analysis: Geometric Mean, Growth Rate & Forecasting | Eps #4
SQL Analysis Project: Identifying Outliers and Department Statistics
zhlédnutí 3,5KPřed rokem
SQL Analysis Project: Identifying Outliers and Department Statistics
The Future of Data Analysis: Using A.I. Models in Data Analysis (LangChain)
zhlédnutí 4,6KPřed rokem
The Future of Data Analysis: Using A.I. Models in Data Analysis (LangChain)
Why Most Data Analysis Projects Fail | Avoid These Common Pitfalls
zhlédnutí 2,6KPřed rokem
Why Most Data Analysis Projects Fail | Avoid These Common Pitfalls
Maximizing Advertising ROI through Budget Optimization | Python Tutorial
zhlédnutí 2KPřed rokem
Maximizing Advertising ROI through Budget Optimization | Python Tutorial
How to Analyze Data - A Step by Step Guide
zhlédnutí 5KPřed rokem
How to Analyze Data - A Step by Step Guide
Marketing Campaign Analysis | Saturation, Distribution, and Probability
zhlédnutí 3,4KPřed rokem
Marketing Campaign Analysis | Saturation, Distribution, and Probability
Calculate Customer Lifetime Value | Python Tutorial
zhlédnutí 5KPřed rokem
Calculate Customer Lifetime Value | Python Tutorial
Use Prophet Model for Easy Python Forecasting
zhlédnutí 3,1KPřed rokem
Use Prophet Model for Easy Python Forecasting
How to Code a Model in Seconds! | ChatGPT & Python
zhlédnutí 2KPřed rokem
How to Code a Model in Seconds! | ChatGPT & Python
Tricky SQL Screening Question | Applicants Failing to Get the Query Correct
zhlédnutí 1,6KPřed rokem
Tricky SQL Screening Question | Applicants Failing to Get the Query Correct
Python Project | Visualization | Analysis of Bike Sharing Shop
zhlédnutí 2,6KPřed rokem
Python Project | Visualization | Analysis of Bike Sharing Shop
Create Powerful Customer Segments for Marketing | Data Analysis for Beginners #4
zhlédnutí 11KPřed rokem
Create Powerful Customer Segments for Marketing | Data Analysis for Beginners #4
Amazing Voice To Text With Python In Minutes || How To Convert Voice To Text In 2022
zhlédnutí 3,2KPřed rokem
Amazing Voice To Text With Python In Minutes || How To Convert Voice To Text In 2022
Forecasting in Excel | Seasonality & Confidence Intervals
zhlédnutí 4,3KPřed rokem
Forecasting in Excel | Seasonality & Confidence Intervals
How To Avoid Python Errors In Power BI || Python Power BI Tutorial For Beginners
zhlédnutí 3,7KPřed rokem
How To Avoid Python Errors In Power BI || Python Power BI Tutorial For Beginners
Free Data Analysis Websites For Beginners
zhlédnutí 3,4KPřed rokem
Free Data Analysis Websites For Beginners
Python Visualization Project | Superhero Powers 💪
zhlédnutí 903Před rokem
Python Visualization Project | Superhero Powers 💪
If u can upload data for script and Question for the same in caption, It will be helpful
Amazing so true I recommend
Great content always 😍. Can you please upload advanced level complete Data Analytics projects in Power BI, Excel & SQL
Awesome project! You just ignited my interesting in ML.
Thank you! Great content. 👏
Hi, thanks a lot for the video. i'm having some issue to calculate the revenue. everytime I try I have this message "Operand data type nvarchar is invalid for multiply operator" . i try to change the data type even if I can see number in the price riders column but then the price column is not regnized. Do you have an idea ? thank you
Thank you for your video. It clarifies what a data analyst will possibly work on the job.
I am glad it was helpful!
Could you have used window function instead of subquery
If you think this is a valid solution please place your query here.
This tutoria was quite grannular. I now have a better understanding of Cohort Analysis. Thank you
Thank you for watching
Awesome as always. I find your shorts informative. In order to pretify or beautify the percentage values we could just nestle or wrapp up the field into format( ) in this way format(sum(sales)/(select sum(sales) from trial_data), "p") ❤
Hi thanks for vedio. I am having trouble in interview to write sql query, any suggestions
Use the playlist on this channel to get familiar with the concepts
This probably.one of my favorites which ive completednand updated and edited and improved on. Kimdly help me though with the meaning of the column 'Son' and 'Pet' and their import to this project. Thanks
Hi Gaelim, I'm Gad. I've successfully completed this project using an addition case for 'Age' thus creating five pie icons instead of 4. Kindly help me with the meaning of the word 'Son' - I don't know what it means it's import and how it relates to every other thing. For the Season Names. I used Transform and new column to change 'Unknown' to 'Select All'. To make become the first among the Tile list on the Slicer Icon. I created a table on Data View, called 'SeasonSortOrder', then created to columns called Season_Names and SortOrder.. Used the Model View to link the Season_Names Columns for both tables together. Then added a new slicer and took out the old one. I still need help to know the meaning of the 'Son' Column and it's purpose I didn't get that in the two videos. Please ........
Another masterpiece, you always deliver great content. Question, should profit margin be revenue - cogs which gives gross profit or profit margin, then divide gross profit by revenue to get profit margin%? Thank you.
I didn't understand how did you calculate the price settings, please clarify
Great explanation 🎉
Hi, thank you for sharing this cool project! I use Mac M1 and have to download Azure data studio instead. Azure couldn't map the dteday column as datetime format and the files couldn't be imported. I had to format that column as string instead and it went through fine. I am wondering if there's any other way to import the file with the dteday properly imported as datetime with Azure?
Great video i love it! One thing if the price is per rider the cost should be per rider as well on the revenue. Minute 22:21. Thank you so much for the video
You solve it a min 44:15 LOL. It was all planned to cover Powerquery? Dude loved your video so much. Thank you!
Great video walkthrough on using SQL and Power BI. I learned so much!
i pray you are muslim and go to heaven.u are so amazing job
I need the link of your giphy animation...
Thank you so much. This video has given me great insight on a real-life project as I transition into data analysis. I appreciate this. 🙌
Great presentation. I have stuck with SUM issue. When I perform Measure = (SUM(Query1[revenue]-SUM(Query1[profit])/SUM(Query1[profit] function, the error pops up "The SUM function only accepts a column reference as an argument." Ive tried different approaches without success. Also, there is a message "cannot find parameter [revenue] Please help.
Is it necessary to remove outliers?
Depends on the business purpose, if these outliers are errors or analysis purposes.
I use linux , so what should i be downloading?? can anyone help me setup everything in linux please
Great video, thank you.
Your videos are very helpful. thank you sir
Bravo for this exceptional and very informative content! I have searched everywhere for content that thoroughly covers the business and recommendation aspects, and I must say you are the best. Keep up the great work!
Much appreciated! I'm glad it was helpful
Please for god's sake improve your mic's quality, the video and the project is great, but the voice/mic is not 😭
Select count(shipment_id), month(shipment_date from shipments group by shipment_date order by shipment_date asc;
Thank you so much!
Hello sir, in the weekday column, what days do the numbers 0 to 6 represent?
Thanks!
One tip, you should make a course on Udemy
Thank you! I might just do that!
Hello, during this project I am facing an issue to load data into power bi from sql server. I tried several ways to resolve it but unable to solve. error occurs when I load the data into power bi in the last tab by selecting "Use Current credentials" after this step the error message is " We couldn't authenticate with the credentials provided. Please try again." IF anyone can help me with this it will be very helpful for me.
i hope its rows between current row and 1 following
Im having trouble downloading the csv file from GitHub. I tried ctrl + s but it showed only webpage option from the drop-down list. Could you please walk me through it? Thank you
Can i become a data analyst with a degree in Applied Mathematics?
You can of course. Having a strong foundation in math is a huge advantage
Please keep uploading more Data/Business Analysis Case Study (using SQL or Python)
what is SON?
This is truely awesome. Interesting and challenging query. Step 1. Create two new variables (weekday and period). Extract weekday from the timestamp, Create a new grouping column as period bases on the timestamp using conditional statment case when then. Easy! Step2. From the resulting query in step 1, Count the records based on the weekday and period, and rank them by the total count in descending order. Easy, just like taking breakfast in the morning! Step 3. Select and display the results from the previous step2. Voila.
That could be a good solution if I understand it correctly!
@@absentdata , Sir I was just translating your query using plain english in layman terms. Actually I have replicated your query using food delivery dataset with MySQL. At the end, instead of using he window rank() , just sorted by descendent order. With cte_top_orders as ( -- Step 3 select wk_day, order_periods, count(*) as total_orders from ( -- step 2 Select wk_day, Case When order_place_time in(5, 10) then "breakfast orders" When order_place_time <= 15.5 then "lunch orders" When order_place_time <= 22.5 then "dinner orders" ELSE "late night orders" END as order_periods From ( -- step one SELECT dayname(order_time) as wk_day , time_format(order_time, "%H:%i") as order_place_time FROM food_orders ) as t1 ) as t2 Group by 1,2 order by -3 Limit 2 ) -- step 4- Final Select ROW_NUMBER() over() as Item, order_periods, total_orders From cte_top_orders ;
Can we make the AVG of the avg_price as sub query??
That would not give the average of all the priorities. That would just be an average of all the state average
@@absentdata the first avg make all priorities 8 and think if makes a second avg of the new value of the old avg Wil give us 4 priorities that's mean it's working right?
i love your videos it's so simple
I love your videos. Learning something new with every video
I am glad to hear that!
Awesome, thanks!
Thanks for watching
Hi, getting ready for upcoming test case for interview, learned A lot of useful things by watching all of your case projects!
Good luck on your case study!
I like you approach very much to keep it simple!
Thank you. I'm glad it was easy to approach
Thank you for this video I love it. but when I try to import data, the columns in the temp and atemp sections don't have dots (.) why? even though the data type is already float. Please reply