
- 32
- 23 221
:probabl.
Registrace 6. 02. 2024
This is the official Probabl CZcams channel where we feature humans teaching and learning about machine learning, data science, and open source. More often than not, we will discuss scikit-learn, as well as a plethora of other tools and libraries to help data scientists, data engineers and data owners extract the most value out of their data.
Benchmarking boosted trees against overfitting
Gradient boosted trees can overfit, which is why you might want to run a few benchmarks to see if you can leverage the hyperparameters that help regularize the stack. However, it can also be good to take these benchmarks with a grain of salt, but they're usually not set in stone either.
The example from the docs of this video can be found here:
scikit-learn.org/stable/auto_examples/ensemble/plot_gradient_boosting_regularization.html
00:00 Introduction
02:04 Shrinkage
06:10 Look at the benchmark again
08:02 Back in the notebook
13:32 Reflection
The example from the docs of this video can be found here:
scikit-learn.org/stable/auto_examples/ensemble/plot_gradient_boosting_regularization.html
00:00 Introduction
02:04 Shrinkage
06:10 Look at the benchmark again
08:02 Back in the notebook
13:32 Reflection
zhlédnutí: 164
Video


Monotonic, and better, boosting
zhlédnutí 563Před 19 hodinami
There are these moments when you actually know something about the relationship between what you're trying to predict and the data that you have. One of these situations could involve monotonicity, which demands that when a variable 'x' goes up, 'y' must go down. Or vise versa. If you're dealing with such a situation there's some good news because the boosting implementations of scikit-learn su...

Moving towards KDearestNeighbors with Leland McInnes - creator of UMAP
zhlédnutí 713Před 14 dny
Leland McInnes is known for a lot of packages. There's UMAP, but also PyNNDescent and HDBScan. Recently he's also been working on tools to help visualize clusters of data and he's also cooking up something new that's related to nearest neighbor algorithms. This interview touches all of these topics. If you're interested in learning more about the MoMA exhibition, it was by Refik Anadol: refikan...

Histograms for faster boosting
zhlédnutí 957Před 21 dnem
Gradient boosted machines can take a while to train, but there is an internal trick that we can pull off to make it a whole lot faster to train trees. It turns out that a histogram may be all we need! If you're curious about the code, you can find the notebook for this series here: github.com/probabl-ai/youtube-appendix/blob/main/08-boosting/boosting.ipynb 00:00 Introduction 00:56 Reminder 02:3...

Getting deeper into trees
zhlédnutí 1KPřed 28 dny
To appreciate gradient boosted models it also helps to appreciate how tree models work. In particular we'll dive into how they might not need to go super deep in order to be useful for boosting algorithms but we'll also see what it can be like to be a tree that's about to make a decision on where to make a cut. If you're curious about the code, you can find the notebook for this series here: gi...
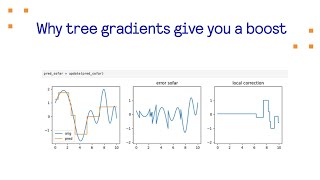
Why tree gradients give you a boost
zhlédnutí 2,1KPřed měsícem
Gradient boosted trees are a powerful machine learning technique that appear a lot in practice. There's a lot to like about their performance but there are plenty of other details under the hood that are worth having a deeper look at. That's why we're doing a long series of videos about these models, start with this first one that's all about the intuition. If you're curious about the code, you...

Talk like a DataFrame, run like SQL with Phillip Cloud - core-committer on Ibis
zhlédnutí 399Před měsícem
Ibis is a Python library that offers a single data-frame API, from Python, which can run your queries on many different backends. These include databases like Postgres, but also commercial vendors like BigQuery and Snowflake. This ability to control multiple backends from a single API has a lot of use-cases, as well as maintainer challenges, all of which are discussed in this episode., To learn...

The StandardScaler is not Standard
zhlédnutí 1,1KPřed měsícem
There is a scaler in scikit-learn called the "StandardScaler". The name might imply that it is standard or fairly basic., but once you consider the implementation details that are required for all the edge cases the it's actually far from "standard" . The goal of this video is to explain why. Hopefully, by the end of this video, you'll appreciate all the tiny details that scikit-learn handles u...

Enhancing Jupyter with Widgets with Trevor Manz - creator of anywidget
zhlédnutí 669Před 2 měsíci
Enhancing Jupyter with Widgets with Trevor Manz - creator of anywidget
Pipelines for convenience, *and* safety
zhlédnutí 645Před 2 měsíci
Pipelines for convenience, *and* safety
Random Search is better, but there is one caveat
zhlédnutí 1,1KPřed 2 měsíci
Random Search is better, but there is one caveat
Drawing a Dataset from inside Jupyter
zhlédnutí 536Před 3 měsíci
Drawing a Dataset from inside Jupyter
Generating Periodic Features for Seasonal Timeseries
zhlédnutí 991Před 3 měsíci
Generating Periodic Features for Seasonal Timeseries
Image Classification with scikit-learn
zhlédnutí 1,2KPřed 4 měsíci
Image Classification with scikit-learn
It's very interesting how poorly the histogram boosted classifier did also, there might be some more parameters to investigate. Great video.
Another great video thanks ! 🎉
Very interesting and insightful!
Best video series on gradient boosted tree models!
So impressed with his packages. Love using this all in bertopic pipelines. Super helpful to get the bird’s eye view on your data.
This reminds me of LangChain Expression Language and the chain operator in Thinc. Love it!
What a coincidence, I was looking something similar for regression. Thanks for the video 🎉 I was going to try isotonic regression. scikit-learn.org/stable/modules/generated/sklearn.isotonic.IsotonicRegression.html I am wondering if I could somehow control the "smothness" of the fitted line. I am trying to model price elasticity and the standard technique is to use a parametric (exponential function). That way we have a smooth line but it is restrictive. We have a domain knowledge, if the price goes up demand goes down (similar to age<>alive relationship as you mentioned in the video).
I enjoyed the video and learned a lot. One small item but also useful that I see above is that FunctionTransformer with no argument is the identity function. Good to know.
Great video! That touch of causal inference with the causal graph made me really happy. Thinking through the problems we're trying to solve is so important!
Great video ! (As usual :) ) 🎉
thanks for the good content. one suggestion, a consistent color code and axis label would help the audience follow.
This is super cool stuff. Would be interested to see in-depth dive into UMAP and HDBScan in the following videos
29:00 Are likelihood scores comparable across different GMMs like that? The way to explain it makes me think yes, but I am also always careful with the math bits as there are a lot of underlying assumptions (as you mention) that _could_ come and bite you in the ass sometimes.
Otherwise fully agree with your point about being careful where we haven't seen data.
(Vincent here) Numerics aside, they should both resemble probability distributions that integrate to 1. So a likelihood from one distribution feels like it can be compared to the likelihood of another. This holds in 1 dimensional distributions or n dimensional ones.
@@probabl_ai yeah, I guess I arrived at the same conclusion. Or at least can’t see how that would not be the case…
Hey, man! Great videos, I've been watching you and like a lot of your style. Can you share how you draw things with your mouse to complement your explanation?
(vincent here) Screenflow + Screenbrush. My calmcode site has a course with all the details calmcode.io/course/content/introduction
very nice and informative video next is bayesian optimizations if its ok
10:50 explanation seems to convey the idea that the left branch only grows AFTER the right branch hits max depth of tree. However aren't trees designed to have branches acting independently and locally within it's own subset of rows? The left branch would not need to care whether the right branch hits max depth. It can lower it's metric in parallel with the right branch. Any independent improvement on any branch would also contribute to a global improvement.
Vincent here. The main goal of this video was to get an intuition going and it's certainly the case that I've omitted a bunch of details. I also think that you're right to point out that branches could keep on going deeper independently until a max depth is reached but in terms of 'where will the next cut take place' you can argue that at some point it won't happen in a region of the tree where the maximum depth has been reached. That's the main point I am trying to convey here because the boosting is able to help out in these maximum depth scenarios. When one tree cannot go deeper, the tree that follows can do that instead!
@@probabl_ai If max depth constraint was a motivation to invent boosting, how about just remove the constraint and use 1 tree with unconstrained depth? If the counterargument is overfitting, doesn't boosting many shallow trees overfit too? Do you know of any resources comparing 1 deep tree vs boosted shallow trees?
@@Han-ve8uh Multiple shallow tress are typically better since like in Gradient boosted trees, their contributions are discounted using parameter called the learning rate. I don't think that has been mentioned here.
7:40 Could you explain the differences? One difference i see is your cut locations are chosen each time based on the global error value, meaning it considers all rows, but for regression trees, the cut location is based on a metric calculated only for rows on a branch right? (assuming we are not at root and have already cut once so some rows belong to left branch, some to right branch). If true, will your cut locations that look at all rows match the cut locations that only look at subset of rows?
Vincent here. If the metric is improved on a subset of the rows, wouldn't that also immediately imply that the global error goes down? There is a subtle difference for sure, but a lot of the intuition is still intact. You're of-course right to point out that my simulation here isn't a perfect reflection of the tree implementation in scikit-learn, and I agree that video could be improved by mentioning that caveat more explicitly.
Is there intuition on how boosting impact calibration of output probability?
(Vincent here) This might depend a lot on the hyperparameters of the full pipeline. In general though calibration is always a good thing to consider once a boosted pipeline is trained.
This is the most practical session, I have seen on Ibis. Thank you Sir. The ability to write composable, testable and portable code for so many backend is insane.
this is a really great idea--essentially a grammar of graphics/ggplot setup for pipelines :) essentially you kind of build an algebra of pipelines and all the operations are closed (takes a pipeline and returns a pipeline) also thanks in general for putting up these videos, your channel in general is an awesome ML resource
super informative! i am being exposed to new ideas😊
Today we learned that playtime is an unavailable project name of pypi, so we renamed this project to scikit-playtime. Sorry for the confusion folks, we should've claimed it earlier. Our bad!
This is the new repository: github.com/koaning/scikit-playtime
Vincent this looks super fun! A couple months ago I was asking myself why don't we have a "modeling" layer on top of the sckit-learn. And now I am optimistic that we will have one soon :) How do you feel about allowing multilevel models? For example suppose you have store level sales data and you would like to introduce a separate intercept for each store. Or you have multiple products in different product categories and you want to try two different models like in one model you have a single holiday coefficient, in the second model you may want try to have separate holiday coefficients for each product category. I think it could be useful to take some inspiration from probabilistic programming language libraries in general. For example, I really like "STAN"s approach which makes you think directly in mathematical notation. Thanks again for this experiment, please keep going. I hope that it ends up to a mature project. I really would love to use it in the future!
(Vincent) It was stuff like this that I had in mind when I started exploring this space. My direction won't be exactly to do proper multilevel stuff like STAN/PyMC might do it. But my gut feeling is that we can do something that's close enough and fast to train by doing cool things with features/preprocessing/modelling. The joke here is that I have a bag of tricks, not just words ;) That said, all of this stuff in the video is very experimental and doesn't resemble what might be in scikit-learn. It could also live on as an idea on top of it or it might turn out to be a bad idea after giving it some more serious datasets. Time will tell!
I was going to comment that you it looked like you were re-implementing formulas from R, but right at the end you explained that the inspiration came from R 😄
There are some subtle difference actually, but yeah, the venn diagrams certainly overlap.
Great video to master the trees!
Thanks 👍
Awesome intuitive explanations! As always from Vincent.
great work!
Hey Vincent very good stuff as always, please keep going. Before watching the video I wasn't sure about the main objective of the narwhals project, now I think I understood. But now I am trying to figure out what is the advantage of using narwhals library instead of switching between pandas and polars by calling to_pandas() and from_pandas(). I thought one of the the motivations of apache arrow project is to have a common memory structure to make possible to move from one library to another with no cost. Maybe this is not totally possible which is why you need narwhals?
Hey, thanks for your interest! Forcing users to convert Polars to pandas (or doing so on their behalf) would: 1. break any optimisations Polars was doing 2. require pandas and PyArrow to be required dependencies - take together, they're huge 3. require much more memory
@@marco_gorelli If nw is returning the df in the original format, wont it require those dependencies anyway?
@@Mayur7Garg that's right! The idea is that nobody needs any extra dependencies: - pandas users just need pandas - Polars users just need Polars - etc... Narwhals never imports pandas/Polars internally, it just checks if they're already loaded into `sys.modules`, and if so, takes them from there. It just uses what the user is already using. In that sense, it's as lightweight as it gets I'll post some benchmarks on how much better this is compared with the "just convert to pandas" approach
Fantastic and clear presentation as always, Vincent!
Did you change something about the audio? It sounds better than usual!
Nitpicking alert: The standard deviation is NOT the average distance of the samples to the mean. You would naively assume that's what a "standard deviation" would be about, but it's not. (I am sure you know this, but still wanted to point it out because it can be confusing).
These deep dives are very useful! Thanks Vincent! I always tell my team to leverage existing tools, sometimes we like to think "oh, it's not that hard to implement X". And most of the time it actually isn't. However, we find ourselves getting to these edge cases fairly quickly, and then it becomes a whole thing. I'd love to see some scikit-lego related stuff.
Finally somebody did it! Great tool!
Very useful info, thanks!
Weird that temperature seems highest around January and lowest in August. So this can't be air temperature in Maine... or?
(Vincent here) That's an astute observation and I'm a bit ashamed that I didn't observe that! It may be another place then, yeah.
Oh my go dthat shade of blue and orange brings back memories of my data science course ahhhhh matplotlib in my dreams >.<
Now do random numbers drawn from a distribution with Pareto-tails with tail exponent < 2 ;)
Cheers, this was great! Hope to see a follow up, that last data set looked interesting!
Hey, thanks for making this video. great pace and good information density
how do you do the drawing?
Wacom One tablet with an app called screenbrush!
could you please make more time series videos
Will do!
Thank you :)
As promised, the jupyter notebook can be found on our CZcams appendix repository here: github.com/probabl-ai/youtube-appendix/blob/main/00-livestream/timeseries.ipynb
is there a possibility to split pipelines? like for example making a train test split and outputting X and y into different pipelines?
You can use make_union to get a split which will merge later, but in general the `y` is ignored by transformer components. These only change X.
@@probabl_ai thank you!
Hi your videos are great especially for beginers like me..can you do a video on model stacking.
Beautiful. Great stuff.
Happy to hear it!
Hi @probabl_ai, great session! What do you think about using the SHAP matrix as the embeddings that are fed to the KNN as an alternative to the features weighted by the Ridge coefficients? I did something similar in a recent project. I was inspired by a blog post that projects the SHAP matrix to 2D and visualizes it to see clusters. I can't seem to link the blog post URL here without CZcams deleting my comment but here's the title that you could google "Supervised Clustering: How to Use SHAP Values for Better Cluster Analysis" With SHAP I can imagine it being more flexible since you can use tree-based models. The values in the SHAP matrix should be normalized by default and interpretability might be easier since you don't have to one hot encode if you're using a tree-based model. Would like to hear your thoughts!
While I agree it's an interesting idea for clustering ... I think that I'm less interested in clustering in this case since it's a pretty well defined regression problem. I'll keep it in mind as food for thought though because I'm eager to revisit this in a later video.
Yeah, the SHAP values could be used for retrieval nearest neighbor comparisons also. Looking forward!
In case folks are interested, we posted an issue on Github on the LanceDB side and got a nice conversation going that helps explain what is happening. If you're eager to index these kinds of datasets there's a bunch of remedies listed here: github.com/lancedb/lancedb/issues/1222
Good summary. The video title made me feel it was about scaling the size of the data set (number of points) and not the features. 😆
same
Great video! I think you nailed the explanation. It is nice to see how to use Jupyter widgets as tools to explain ML-related concepts.
Thanks! Speaking of widgets. Seen these? czcams.com/video/STPv0jSAQEk/video.html czcams.com/video/goaBFxGhp6Y/video.html