
- 236
- 543 160
ViSIT
United States
Registrace 10. 12. 2020
Welcome to our tutorial CZcams channel, where we provide expert instruction and guidance on a variety of business intelligence and data visualization tools, including Power BI, SQL, JavaScript, Python, and MS Excel. Whether you're a beginner or an experienced professional, our comprehensive video tutorials will help you take your skills to the next level and unlock the full potential of these powerful tools. With our clear, easy-to-follow instruction and hands-on demonstrations, you'll be able to master the latest techniques and best practices for data analysis and visualization. So, whether you're looking to boost your career or just want to improve your skills, subscribe to our channel and start learning today!
Using Dropdown Lists Effectively to Summarize Data and Build Dashboards and Reports in MS Excel
The video tutorial demonstrates how to create a comprehensive report in MS Excel using a drop-down list. The tutorial begins by explaining how to set up a data set with quarterly sales information, including location details. It then guides viewers through the process of creating a drop-down list, which allows users to select specific countries, regions, or stores. The tutorial also covers how to use summary functions and create charts to visualize the data effectively. Overall, the video provides step-by-step instructions on how to utilize a drop-down list to create dynamic and informative reports.
#MSExcelTutorial #DropdownList #ReportCreation #DataVisualization #BusinessAnalytics #ExcelTips #DataAnalysis #ExcelExpert #Tutorial #LearnExcel #ExcelHack
#MSExcelTutorial #DropdownList #ReportCreation #DataVisualization #BusinessAnalytics #ExcelTips #DataAnalysis #ExcelExpert #Tutorial #LearnExcel #ExcelHack
zhlédnutí: 215
Video


Build a Stunning Animated Olympics Javelin Dashboard with Power BI
zhlédnutí 219Před 21 dnem
This tutorial demonstrates how to create an animated Power BI dashboard showcasing Olympic javelin gold medalists. Starting with AI-generated data, we guide you through building a dashboard with key metrics like longest throw, athlete information, and historical performance trends. The process involves using various Power BI visuals, formatting for aesthetic appeal, and incorporating a play axi...

Analyse and Visualize Google Forms Responses using Power BI by Integrating Forms with Power BI
zhlédnutí 336Před měsícem
This tutorial demonstrates how to integrate Google Forms responses with Power BI Desktop to create interactive visualizations. It covers creating a Google Form, collecting responses, and connecting the resulting spreadsheet to Power BI. The video then walks through building a dashboard with various charts to analyze the collected data, including using AI to calculate values within the dashboard...

Advanced Power BI Realtime Project: Using Same Dashboard for Data Input and Output into SQL Server
zhlédnutí 838Před měsícem
The provided subtitle describes an advanced Power BI tutorial on creating real-time data connectivity through change detection and auto-refresh. Goal is to create a Power BI project enabling real-time data entry into a SQL Server database from the Power BI dashboard. - Create new tables in the SQL Server database (buyers, products, sales). - Modify table structures (change data type, add column...

Real time Monitoring with Power BI and SQL
zhlédnutí 643Před 2 měsíci
This video tutorial demonstrates how to set up a real-time call center monitoring dashboard using Power BI and SQL Server. The data for the dashboard comes from call logs stored in a SQL Server database. The call logs include information such as the date and time of the call, the origin and destination of the call, the call duration, and the call rating. The dashboard uses a variety of visuals ...

Creating and Using Flow Maps in Power BI with Free Dataset
zhlédnutí 560Před 2 měsíci
This tutorial explains how to create a flow map visualization in Power BI to show product exports from China to various countries around the world. It covers downloading a custom flow map visual, preparing the data, and using the visual to create a dashboard. #PowerBI #FlowMap #DataViz #ExportMap #Tutorial #BusinessIntelligence #Dashboard #CustomVisual #StarInternational
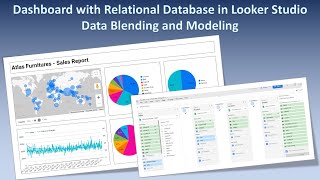
Dashboard with Relational Database in Looker Studio Data Blending and Modeling
zhlédnutí 453Před 2 měsíci
This Looker Studio tutorial creates a data model (blend) from a sample Atlas Furniture dataset with multiple tables in Google Drive. It covers how to add data sources (tables), create relationships between them, manage data sources, and edit blends. It also demonstrates how to add calculated fields and handle limitations when working with many tables. Finally, it shows how to create a basic das...

Power Pivot and Data Modeling in MS Excel - Learn in Five Minutes
zhlédnutí 156Před 3 měsíci
Power Pivot is a powerful tool in Excel that allows you to work with large and complex datasets. It can import data from various sources and create data models with connected tables. You can also use DAX functions to create new columns and perform calculations. Finally, you can create pivot tables and charts to analyze your data. This tutorial guides you through the process of setting up Power ...

Power BI: Project Weighted Decision Matrix Dashboard #projectmanagement
zhlédnutí 204Před 3 měsíci
This video tutorial demonstrates how to use Power BI to perform a weighted decision matrix analysis on a set of projects. We start by loading an Excel file containing project details, criteria, scores, and weights. Then, we create a new table called "Weighted Score" and populate it with the product of score and weight for each project-criteria combination. Using various visualizations like bar ...
Using Custom SQL Queries in Power BI #sql #powerbi #tutorial #customsqlqueries #customqueries
zhlédnutí 1,4KPřed 3 měsíci
This tutorial explains how to use custom SQL queries in Power BI to manipulate data before loading it. It covers connecting to a SQL Server database, entering a custom SQL statement, and modifying the query afterwards. The video also demonstrates how this can be used to filter data based on specific criteria and create visualizations. #PowerBI #SQL #Tutorial #CustomQueries #DataCleaning #DataMa...
Diversity, Equity, and Inclusion (DEI) Initiative Tracker Using RAG Status - Project Management
zhlédnutí 339Před 3 měsíci
This video tutorial shows how to use Power BI to track Diversity, Equity, and Inclusion (DEI) initiatives using a RAG rating system (Red, Amber, Green). You'll learn how to import data, create RAG symbol tables, connect them, and visualize progress with slicers, charts, and tables, all while ensuring the colors align with the RAG status for better understanding. #PowerBI #DEI #DiversityEquityIn...
Complete Guide to Using Drawing Tools in MS Excel #tutorial #drawingtools #excel #howto #learn
zhlédnutí 116Před 3 měsíci
This video tutorial describes the drawing tools available in Excel. It covers adding the Drawing tab to the ribbon if it's missing, using pens, pencils, and highlighters to draw and erase, selecting drawings, and converting freehand drawings to clean shapes. It also explains how to use the action pen to write text and formulas directly into cells, and the Ink to Math tool to convert handwritten...
Gantt Chart in Power BI: Complete Guide #tutorial #ganttchart #powerbi #projectmanagement
zhlédnutí 4,3KPřed 4 měsíci
This video tutorial explains how to create a Gantt chart in Power BI. It walks you through the data required, including tasks, start dates, and end dates. You can also include additional information such as projects, progress, resources, and milestones. The video also shows how to import a custom Gantt chart visual and configure it to display your data. #PowerBI #GanttChart #Tutorial #DataViz #...
Monitoring Progress Using Gantt Chart - Indigeno Technologies Part 3
zhlédnutí 92Před 4 měsíci
This video is part of a multi-part tutorial on using Power BI with a dataset called Indigino Technologies. In this particular part, you will learn how to create a Gantt chart to track the progress of orders. The video walks you through the steps of adding the necessary columns to your tables, formatting the data types, and creating a new dashboard with a Gantt chart visual. With this chart, you...
Creating a Dashboard of Sales Process and Pregress (Indigeno Technologies Part 2)
zhlédnutí 128Před 4 měsíci
Creating a Dashboard of Sales Process and Pregress (Indigeno Technologies Part 2)
Data Modeling, Creating Relationships, and Tables using DAX (Indigeno Technologies - Part 1)
zhlédnutí 271Před 4 měsíci
Data Modeling, Creating Relationships, and Tables using DAX (Indigeno Technologies - Part 1)
Creating and Publishing Web Applications using HTML and JavaScript: A Unicode Symbol Generator
zhlédnutí 78Před 4 měsíci
Creating and Publishing Web Applications using HTML and JavaScript: A Unicode Symbol Generator
Make Your Data Grow: Tree Stats with Power BI
zhlédnutí 158Před 4 měsíci
Make Your Data Grow: Tree Stats with Power BI
Power BI: Adding Historical Data to Existing Dashboard in Power BI - Staff Engagement Report Part-II
zhlédnutí 634Před 4 měsíci
Power BI: Adding Historical Data to Existing Dashboard in Power BI - Staff Engagement Report Part-II
We asked an AI to create a web application for us. Learn to build apps without any coding.
zhlédnutí 180Před 5 měsíci
We asked an AI to create a web application for us. Learn to build apps without any coding.
Power BI: Staff Engagement Dashboard with Data Transformation from MS Excel
zhlédnutí 435Před 5 měsíci
Power BI: Staff Engagement Dashboard with Data Transformation from MS Excel
Using Unicode Symbols in Excel and Power BI and Converting Symbols to Code and Back in Excel
zhlédnutí 313Před 5 měsíci
Using Unicode Symbols in Excel and Power BI and Converting Symbols to Code and Back in Excel
Power BI: Timesheet Analysis | Construction Co. Example | Worker Hours Report | Project Management
zhlédnutí 1,4KPřed 5 měsíci
Power BI: Timesheet Analysis | Construction Co. Example | Worker Hours Report | Project Management
Time Machine for Your Database: Track Every Change with SQL Server
zhlédnutí 320Před 5 měsíci
Time Machine for Your Database: Track Every Change with SQL Server
Azure Data Studio - Complete Guide for Beginners including SQL, Python, Sanddance and Dashboards
zhlédnutí 574Před 5 měsíci
Azure Data Studio - Complete Guide for Beginners including SQL, Python, Sanddance and Dashboards
Power BI: Creating a Stunning HR Performance Dashboard using Images and Slicers and Visuals
zhlédnutí 295Před 5 měsíci
Power BI: Creating a Stunning HR Performance Dashboard using Images and Slicers and Visuals
Power BI: Project Payback, and Cost and Benefit Analysis using DAX and Power BI Dashboards
zhlédnutí 474Před 5 měsíci
Power BI: Project Payback, and Cost and Benefit Analysis using DAX and Power BI Dashboards
Power BI: Complete Realtime Dashboard Demo using SQL Server Database from start to end
zhlédnutí 4,8KPřed 5 měsíci
Power BI: Complete Realtime Dashboard Demo using SQL Server Database from start to end
Power BI: DAX Query View for Beginners - Supercharge Your Dashboards with DAX Query View
zhlédnutí 1,6KPřed 5 měsíci
Power BI: DAX Query View for Beginners - Supercharge Your Dashboards with DAX Query View
Build Your Own Excel Toolbars: Excel Automation with Add-in created in Visual Studio using VSTO
zhlédnutí 383Před 6 měsíci
Build Your Own Excel Toolbars: Excel Automation with Add-in created in Visual Studio using VSTO
you save my life, thank you
Thanks for your kind words 🙏
thx alot
You are welcome.
Link to the excel file: docs.google.com/spreadsheets/d/1DRJMqBf1RnKwGNuxnBhR5DQeLQnHx7iA/edit?usp=drive_link&ouid=110287700425339553017&rtpof=true&sd=true
Thank you very much for this awesome class. It is good and awesome.
Thanks for your kind words.
You happened to have the same router as i do lol, cool, thanks
Cool content as always! But why is the design so modest? There could be a lot more views. Btw, the new slicer visual is bugging tho? The force selection seems catastrophic
Design is not always the target of my video. I sometime try to present an idea, like race chart etc. Its up to every user how they implement it in their own reports. Presenting something different is always my objective over more views.
How can i change the color of the status ?
where is the dataset used
When I try to connect to SQL Server in Power BI I get this error message: CANNOT CONNECT Details: “Microsoft SQL: A connection to the server was successfully established, but an error occurred during the login process (provider: SSL Provider, error: 0 - The certification chain was issued by an untrusted entity).”????
This is so amazing!
Thanks for your kind words.
This is so amazing! Please update JavaScript series tutorial soon!
Thanks for appreciation, I will try my best to add more javascript tutorials in future.
Hello, please tell me how access the dataset through OData feed, since Shared Dataset arent supported on Report Server. Thanks
What is the visual name? Not mentioned in the video 🤣🤣
Custom visual: Gantt chart
Ok
I have a GesEcole sql server database with the Sections and Options tables. In my python tkinter GUI application, I provide two comboboxes for Sections and Options. I would like when I select a section, the options combobox only displays the options that only concern the section chosen in the combobox and then insert that into the database. The Options table will have the primary key of the Section table. How to achieve it ?
Brilliant☆ This video is what I am looking for which answered my doubts. Thank you.
Thanks for your kind words.
I have a question , how can i sign up in power bi ? I'm student and i tried to sign up login by my gmail account and my university mail but it did not work. what should i do ? I want to public my dashboards like this ... but only i can do that export to pdf but animation things and filters/slicer worked not there in pdf you know..
There are hacks and 'way around' on the internet as to how to get a power bi logon. One of them is creating @onmicrosoft email id. Search the web and see which methods works now a days.
that was amazing 💟
Thanks for your kind feedback.
Can't wait for the second Chapter and more.... Thanks! Really opened my eyes!
Download Files: drive.google.com/file/d/1kNHg64fTTPbFaN6rUW5ND94lQW90rJB9/view?usp=sharing
I have two tables in SQL server :sales and products . I want to insert the product key into the sales table via the combobox using the python language. How to do it?
You will have to execute SQL insert command behind your combobox code. Although I cannot quite understand your problem because I dont know which combobox are you refering to (i guess you have created a GUI using Python?) and what other code you have.
Can you send me the snacky chart download links
please share me
Sure: Download here: drive.google.com/file/d/14KM9Y9kYAjpjbOs7I0bihUYGEZP_UyV_/view?usp=sharing
[01:13:20] [error] Error during _import_file_and_scan: Traceback (most recent call last): File "C:\Users\Administrator\AppData\Local\Programs\Python\Python312\Lib\site-packages\xloil\importer.py", line 252, in _import_file_and_scan module = _import_file(path, addin, workbook_name) ^^^^^^^^^^^^^^^^^^^^^^^^^^^^^^^^^^^^^^^^ File "C:\Users\Administrator\AppData\Local\Programs\Python\Python312\Lib\site-packages\xloil\importer.py", line 184, in _import_file module = importlib.import_module(module_name) ^^^^^^^^^^^^^^^^^^^^^^^^^^^^^^^^^^^^ File "C:\Users\Administrator\AppData\Local\Programs\Python\Python312\Lib\importlib\__init__.py", line 90, in import_module return _bootstrap._gcd_import(name[level:], package, level) ^^^^^^^^^^^^^^^^^^^^^^^^^^^^^^^^^^^^^^^^^^^^^^^^^^^^ File "<frozen importlib._bootstrap>", line 1387, in _gcd_import File "<frozen importlib._bootstrap>", line 1360, in _find_and_load File "<frozen importlib._bootstrap>", line 1331, in _find_and_load_unlocked File "<frozen importlib._bootstrap>", line 935, in _load_unlocked File "<frozen importlib._bootstrap_external>", line 995, in exec_module File "<frozen importlib._bootstrap>", line 488, in _call_with_frames_removed File "C:\python\getltpdatafromexcel.py", line 51, in <module> session_Token=json.loads(login)['sessionToken']
Thanks bro
Fill in the google form, and see its results in Power BI dashboard. Google Form: docs.google.com/forms/d/e/1FAIpQLScJfzWfpVrEyyYChl_c7-VJIT9VgF6L-pJrBl10PK_roiJTUQ/viewform?usp=sf_link Power BI File: drive.google.com/file/d/1_p8jpHk1LTPNpW8-AWkCoWqJDuRlY92D/view?usp=sharing
This is not realtime, one second refresh
Yes. I hope you did your cost and benefit analysis if you want to go for "real" real time and avoiding just one second of latency?
@@virtual_school yes, I need realtime, datastreaming, can you do that?
I do not use most of the stuff required for realtime datastreaming, so cannot do that right now. For me, directquery is the perfect solution as I can produce near to realtime reports on large databases without paying anything, facing any limitations and building complex models.
Excellent Tutorial. Very Useful and Super Clear.
Glad it was helpful!
amazing video thank you. I have question, how can I extract a data from any sources like (icis) and put it in an excel file then automatically build a weekly report in the power bi?
Thanks. Can you tell me more? What is ICIS? I will look into that.
Thanks a lot !
You are welcome!
I need your assistance.... I think you must have forgetten something to mention @08:45. Because when i execute the sql query, Sensor 1 displays SUM value instead of latest value of sql table's SENSOR 1.
As per my setup. Sensor one is just count down, so it shows maximum value, while sensor two is set to show average value. See @8:28. Did you change them from sum to maximum, and average?
@@virtual_school This is one way but how to view the latest value in SQL table using SQL query or something?
For that you need another timestamp column and based on that you will need an sq query such as "select top 1 yourcolumn from yourtable order by timestampcolumn desc", or similar other query.
@@virtual_school Yeah correct. For that matter, we can also create and go with id column as well.
muito bom! faz mais
Thanks
I had a problem, when i try to drag datekey from date table and duedate from sales table the connecting line is not appearing. no tonly that these two keys have sigma(aggregation) symbol with them which i dont see in your video. i tried to get help from copilot and gemini but nothing helped. do you have any clue to resolve this ? am i using a different version of the excel sheet ?
Did you resolve the issue? Sorry I was not available.
Parabéns, mostra obtendo informações de ações
How can we help you?
actualy this is not real time dasboard refresh 1second refresh rate
You are right, but if you go to cost benefit and efforts involved, it is the best solution.
နားမလည်လို့ကူညီပေးပါလား.စိတ်ဝင်စားလို့.......
Can you please use english? I cannot understand what you are saying. Thanks.
How to deploy this to PowerBI Service? It looks like it works for PowerBI Desktop.
Did to try to upload this to power bi service? did it work?
Data has many blanks, specially in Income column, is the right solution to remove theses rows?
The best way to deal with blanks in this type of data is to remove those rows, as you cannot guess their values such as income.
bagaimana kalau routernya tidak ada fitur forwading portnya maseh ?
Port forwarding is must to take your server public.
Thank you so much!
If you do not want to create sql tables, views and the server side programming. You can also use this tutorial to practice power bi only. Use our server credentials to create a power bi dashboard shown in this tutorial, using our sql and aspx server. Link to the Power BI file: drive.google.com/file/d/1D3WIQqsZK_f87Xjr6nOUkA8NatFRbjyH/view?usp=sharing
thanks
You're welcome!
This is so beautiful and helpful. Thanx a million times! #2024
Thanks a lot for your encouraging feedback.
I felt like reading a medieval story, beautiful job!
This topic put in resume project or not
If you feel its worth putting in your resume, plz go ahead.
im not able to download in mac
Sorry, I only use Windows, so cannot help you with mac.