
- 178
- 880 569
KnowledgeBank by obviEnce
United States
Registrace 23. 01. 2020
Let’s get smarter together.
www.obvience.com
www.obvience.com
Is Copilot in Power BI getting better ?
Exciting news from the Power BI team! The new Copilot update now allows Copilot to answer questions against the semantic model. In this video, we'll give this feature a try and see firsthand how much better Copilot has gotten.
Tags: #MicrosoftCopilot, #PowerBI, #DataAnalytics, #AIDataVisualization, #BusinessIntelligence, #AITools, #DataScience, #PowerBITutorial, #TechInnovation, #DataDrivenDecisions
Tags: #MicrosoftCopilot, #PowerBI, #DataAnalytics, #AIDataVisualization, #BusinessIntelligence, #AITools, #DataScience, #PowerBITutorial, #TechInnovation, #DataDrivenDecisions
zhlédnutí: 347
Video


DAX for Time Series forecasting - 2 - Q&A #powerbi #microsoftfabric #financialanalysis #forecasting
zhlédnutí 681Před 21 dnem
Original video: czcams.com/video/Suiw1hxtaUI/video.html R Code for Time Series Analysis: github.com/microsoft/powerbi-visuals-timeseriesdecomposition/blob/master/script.r Today, we're diving back into Power BI and DAX calculations to explore how to implement time series analysis. Unlike the usual methods that rely on built-in forecast feature of the Power BI line chart, we're focusing on doing ...

Create a Powerful Forecast Template in Power BI with Inforiver Visual #powerbi #fabric #forecasting
zhlédnutí 215Před 28 dny
Welcome to the in-depth tutorial on using the Inforiver visual in Power BI to create an advanced forecast template! This video will guide you step-by-step through the process of setting up a forecast template that includes rolling forecasts, closing periods, redistributing forecasts, and organizing measures in rows. In this video, you'll learn how to: Create a Rolling Forecast: Set up a dynamic...
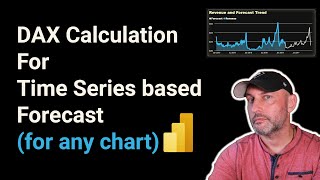
DAX Calculation for Time Series Forecast #powerbi #microsoftfabric #financialanalysis #forecasting
zhlédnutí 1,7KPřed měsícem
Today, we're diving back into Power BI and DAX calculations to explore how to implement time series analysis. Unlike the usual methods that rely on built-in forecast feature of the Power BI line chart, we're focusing on doing everything with DAX. This gives you more flexibility to create forward-looking reports and dashboards. In this video, you'll learn: - The basics of time series analysis in...

Enterprise Grade RAG in #Microsoft #Fabric using #CosmosDB and #DiskANN (background and tutorial)
zhlédnutí 544Před měsícem
In this video, we’re hardening our RAG architecture to meet the demands of the enterprise! Building on our previous video (czcams.com/video/jwVOQCUUH1Y/video.html), we are making our RAG for Microsoft Fabric enterprise grade. Link to our blog for the code used in this video: www.obvience.com/blog/enterprise-grade-rag-in-microsoft-fabric-using-cosmosdb-and-diskann In this video, we explore the i...

Step-by-Step Guide to the Best Planning and Forecasting Visual in Power BI - #inforiver #powerbi
zhlédnutí 337Před měsícem
This is a comprehensive guide to configure the best planning and forecasting visual in Power BI - Inforiver! In this video, I will walk you through the steps to set up and optimize the Inforiver visual for your planning and forecasting needs. What You'll Learn: Different Layouts: Explore the various layout options available in Inforiver. Visual Effects: Learn how to enhance your visuals with bu...

Discover the No-Code Solution for planning, forecasting and writeback in #powerbi with #inforiver
zhlédnutí 306Před měsícem
Unlock the full potential of Power BI with the revolutionary no-code solution! In this video, we explore the key features that make Inforiver a game-changer: No Code Solution: Simplify your workflows without writing a single line of code. End to End Security: Ensure your data is protected with comprehensive security measures. Built-In Approval Process: Streamline your operations with an integra...

The Basics of Promotion Effectiveness and Category Management #powerbi #msfabric #salesanalysis
zhlédnutí 266Před měsícem
In this video, we delve into using Power BI to manage your sales with a focus on promotion effectiveness and category management. Learn how to analyze sales trends, understand key business drivers, and plan effective promotions to boost your market share. Key Topics Covered: - Year Over Year Sales Analysis - Importance of Price, Volume, and Cost Walk - Identifying Divergence in Sales Trends - R...

Direct Lake vs Direct Query? Which one is used and how to validate #msfabric #powerbi
zhlédnutí 148Před měsícem
In this video, we explore: The key differences between Direct Lake and Direct Query modes How each mode impacts data retrieval and performance The tools you can use to validate if you're using a Direct Lake connection, including Query Analyzer and Profiler #msfabric #powerbi #datalake #directlake
How to - OneLake Role Based Data Access #msfabric #datasecurity #onelake
zhlédnutí 228Před 2 měsíci
Welcome to our step-by-step tutorial on configuring Role-Based Data Access for OneLake in Fabric! In this video, I guide you through the entire process of setting up role-based security for your data in OneLake. Whether you're a beginner or looking to refine your skills, this tutorial will help you ensure that your data is accessed securely and appropriately within your organization. #DataSecur...
Forecasting and Making Predictions with GenAI / LLMs in #MicrosoftFabric using #langchain #OpenAI
zhlédnutí 1,3KPřed 2 měsíci
Today, we're tackling a topic you probably haven't seen before: how to forecast and make predictions in Microsoft Fabric using Generative AI and Large Language Models (LLMs). While most videos focus on LLMs as assistants or copilots, I find that use case uninspiring and soon-to-be commoditized. Instead, I'm focused on logic intelligence-applying GenAI to core app logic, business, and data proce...
Implement #RAG (Retrieval Augmented Generation) with #langchain #chroma #OpenAI #MicrosoftFabric
zhlédnutí 1,8KPřed 2 měsíci
In this video, we’re taking our RAG architecture to intergalactic levels! Building on our previous video (czcams.com/video/oCHinlZRsLU/video.html), we’re removing dependencies on PaaS components like Document Intelligence and Azure AI Search. Instead, we’re leveraging LangChain to process PDF documents and using the open-source vector database, Chroma DB, as our vector store. Timeline: 00:00 - ...
How to understand DW query cost? #msfabric #powerbi #datawarehouse
zhlédnutí 190Před 2 měsíci
In this video, we explore how to determine the cost of each activity, focusing specifically on the cost of Fabric DW queries. This isn't a straightforward task, so we'll guide you through using the Fabric Metric app and Query Insights to gather all the necessary information. Join us as we uncover the steps to accurately figure out these costs.
Stack Chart that actually provides insight #powerbi #msfabric #datavis #dax
zhlédnutí 154Před 2 měsíci
In this video, we explore how to create stacked column charts with better or worse indicators using Power BI. This tutorial is perfect for anyone looking to add deeper insights into their dashboards. Key Topics Covered: - Overview of Stacked Column Charts - Importance of Contextual Insights - Challenges with Stacked Column Charts - Creating Effective Stacked Charts for Retail Data - Adding Bett...
Cost and Performance Considerations when ingesting data into Microsoft Fabric
zhlédnutí 444Před 2 měsíci
Microsoft Fabric offers various options for data ingestion, including Dataflow (with and without Fast Copy), Data Pipeline, and Notebooks. With so many options available, it's essential to understand which one to use and when. Join us as we explore the differences between these options and determine the best use case for each. #msfabric #notebook #dataflow #datapipeline
How good is Copilot in Dataflow Gen 2? #msfabric #powerbi #copilot
zhlédnutí 349Před 3 měsíci
How good is Copilot in Dataflow Gen 2? #msfabric #powerbi #copilot
How to remove blanks and repeats form tables and charts in parent child hierarchies #powerbi #dax
zhlédnutí 894Před 3 měsíci
How to remove blanks and repeats form tables and charts in parent child hierarchies #powerbi #dax
Copilot in Power BI Desktop - what does good look like? #powerbi #copilot #msfabric #review
zhlédnutí 3,1KPřed 3 měsíci
Copilot in Power BI Desktop - what does good look like? #powerbi #copilot #msfabric #review
What is FAST COPY ? Explained... #msfabric #powerbi #dataflow
zhlédnutí 346Před 3 měsíci
What is FAST COPY ? Explained... #msfabric #powerbi #dataflow
Price Volume Cost Mix for Gross Margin analysis in action #powerbi #msfabric #financialanalysis
zhlédnutí 1,1KPřed 3 měsíci
Price Volume Cost Mix for Gross Margin analysis in action #powerbi #msfabric #financialanalysis
Want Power BI reports with Real-Time data ? Data Mirroring is here...#msfabric #powerbi #realtime
zhlédnutí 461Před 3 měsíci
Want Power BI reports with Real-Time data ? Data Mirroring is here...#msfabric #powerbi #realtime
Performance Flow by xVIZ is the best visual for Parent Child hierarchies In Power BI
zhlédnutí 1KPřed 3 měsíci
Performance Flow by xVIZ is the best visual for Parent Child hierarchies In Power BI
Copilot in Action - How good is it with writing code in Notebooks? #msfabric #copilot #notebook
zhlédnutí 234Před 4 měsíci
Copilot in Action - How good is it with writing code in Notebooks? #msfabric #copilot #notebook
How to use LangChain Agents to query Power BI datasets in Microsoft Fabric (Tutorial for beginners)
zhlédnutí 2,2KPřed 4 měsíci
How to use LangChain Agents to query Power BI datasets in Microsoft Fabric (Tutorial for beginners)
Are you new to Notebooks ? Data Wrangler is your assistant!
zhlédnutí 190Před 4 měsíci
Are you new to Notebooks ? Data Wrangler is your assistant!
Is Data Activator ready for Prime Time ?
zhlédnutí 286Před 4 měsíci
Is Data Activator ready for Prime Time ?
Implement #RAG (Retrieval Augmented Generation) Architecture with Azure #OpenAI in #MicrosoftFabric
zhlédnutí 2,3KPřed 4 měsíci
Implement #RAG (Retrieval Augmented Generation) Architecture with Azure #OpenAI in #MicrosoftFabric
How to generate Business Friendly #PowerBI Data Dictionary using #OpenAI #SemanticLink #msfabric
zhlédnutí 704Před 4 měsíci
How to generate Business Friendly #PowerBI Data Dictionary using #OpenAI #SemanticLink #msfabric
How to use notebooks for Data Orchestration in Microsoft #MSFabric #powerbi
zhlédnutí 276Před 4 měsíci
How to use notebooks for Data Orchestration in Microsoft #MSFabric #powerbi
Game Changer: Enrich Your Data with Azure OpenAI LLM in a Microsoft Fabric Notebook.
zhlédnutí 1,1KPřed 5 měsíci
Game Changer: Enrich Your Data with Azure OpenAI LLM in a Microsoft Fabric Notebook.
Thanks for the video. I have tried using the data activator by setting an alert from a card visual. However, I am not able to create a new property from a field from the same semantic model to the same alert. Also, not sure how to integrate this trigger to power automate. Currently the users in the email list should have the same domain as the alert owner. I tried by adding an AD group with multiple domain users and didn't work. Is there any workaround you can think of, it would be appreciated.
Hey New Subscriber to you with your Amazing Lesson on Forecasting.. And could you please make a video on IMPORTANT DAX Calculations & SQL Quick tips for Preparing Data Analyst interview Thank you!
And Forgot to say You really blink less number of times in the complete video
Hey and thans a lot for this amazing feature Great success to have a seasonal forecast at month level When displaying it on a graph for 2024 it is perfect (with mensual datas from january 2022 as inputs) Unfortunately, i want to project the forecast cumulative sum at end of 2024 but it doesnt work with classical function as SUMX because it made some mistakes with forecasted measures Do you have a solution for this ?
do you have the code?
Just started with a trial of Inforiver in Power BI and your Tutorials are a great starting point. Would like to see a Tutorial in writing formulas in Inforiver comparing Actual Data vs. Forecast Data, Total etc. I am struggling to address columns correct.
Id loved to learn how you incorporated unit costs into the PVM. Are you able to do a video on that? Much appreciated!
Thank you for sharing. I haven't played with it yet. I'd like to ask regarding 'weeklyData' variable. Why Addcolumns is wrapped in CALCULATETABLE with ALL('Date') modifier? What purpose does it serve?
so we can remove the filters and put the one in place that we need to go back as far as we need to
Brillian job ! I'm still getting the Last Year Column on the right hand side and the Sort category reverted :( any workaround?
Andre as always a very good explanation with clear DAX code. On your new fancy website I can read the DAX code but I'm missing the PBIX.
that's my todo for this week, I can't share the PBIX because it has customer data, so I will have to create a new one and publish it. Hopefully I will have some time over the weekend. And thank you for the website compliment!
love the new hat
Thanks for your time. Unfortunately, results from "Sales Forecast" Measure are off. Is the logic / Dax for "Sales Forecast - Seasonality" ok? EDIT: I think the logic of summing up all prior years could be misleading in growing business.
yes, the video is really more of a way to get creative juices going to think for new and exciting ways to use Power BI and DAX for scenarios that we may not have considered before. I am hoping to have a PBIX that I can share ready this weekend so folks can play with the working measure.
@@KnowledgeBankPro Looking forward! 👍
Thank you for taking the time to explain
My pleasure!
you can find the original video here: czcams.com/video/Suiw1hxtaUI/video.html
this video generated a ton of questions, I tried to answer them all in this video: czcams.com/video/fTv1VJRuHMg/video.html
Well explained bro. Thanks so much Can you share the pbix file
I will hopefully this or next week, will need to create a new one, the one I used I can't share unfortunately.
Thanks man I've been searching for this for an hour
That's really cool! Thank you so much, you made my day 👍👍
I just love how youve been able to do time series forecasting with DAX. Just amazing!! Is it possible to share the pbix file or just the sales data on your blog just to follow along
I will have to build something from scratch, unfortunately, i can't share the file I used as it has sensitive data
Very nice, but I am not able to get this working. In the Measure "Sales Forecast - Trend" from your Blog, i get the message: Can not find name [Slope1]. Any idea? Where is this defined? Thanks in advance!
I am going through every step of this calc in this follow up video: czcams.com/video/fTv1VJRuHMg/video.html
Good morning Sir I Built an Organization Chart with performance flow. I´m having an issue, the images are not showing up. How you did you upload those images on your chart, could you tell me please?
Also, the formula for mix variance is total Current Year Units * (PY unit price - PY average cost/unit) * mix change
When the mix for product A goes from 50% to 40%, the mix variance should be positive as you are selling less of 'bad' stuff
Could you provide the R coding as well I want to try and do both to see how well mine turned ?
i have the link to the code and some background to it i this video description: czcams.com/video/fTv1VJRuHMg/video.html
Could you please share the calculations for each parameters like an equation? This would be of great help ...
Great lesson.On your blog, you added the WeeksCount to the Trend forecast calculation. What's the reason if I should ask
That was added so that the trend starts where the actuals end, otherwise it starts with period one again, that was the error that i noticed during editing of the video
Can i use it without premium account??
unfortunately, you have to have a fabric capacity, and not any capacity, it has to be big enough to support Copilot, which I believe is F64 and above...
Outstanding content. Keep going please.
Thank you! If you have any good topics that you would like us to cover, please let us know
omg I managed to delete several Azure resources with this stupid ARM template. THIS THING IS DANGEROUS!
ouch
when using the template currently, there is no elipsis to click to show the files. any ideas? thank you
sorry, this is video was recorded a while ago, and some options might have changed.. we will look into updating it soon
excellent
Ty!
Great video! Thanks
How to highlight single value in those bullet points?
you can't, you can only highlight entire cell
Hola, sabes que intento crear un gráfico de cascada de la misma forma, pero al agregar un 4to ítem no me lo agrega de manera correcta, favor ayúdame a solucionar este problema, déjame tu email para compartirte mi problema
Would this new dataflow hava any codependecy with the original? What I mean is, if I update this new dataflow, would the original one also update? Is really important that this doesn't happen for me
No this creates new and distinct version of a dataflow that’s disconnected from the original one
Great way to make this more approachable and engaging - Thanks for sharing this.
Ty sir!
Ugh oh. New Andre vid. Time to put the thinking cap on!
Thanks for your helpful vid but I got to admit MS as usual overcomplicate everything its so long winded. Deployment should be much easier than this
totally agreed, I recorded this video because I got so frustrated with it one day that I could only imagine how other people felt so I wanted to do something to help out.
Thank you for the amazing video! Are you planning to share the code as an open-source repo any time soon? Looking forward to it!
if you follow our blog on www.obvience.com/blog you will see more and more posts with code in them. Eventually we will be organizing all this into a free set of classes.
Hi KnowledgeBank, thank you for the tutorial! I'm interested in setting limits in Fabric. Can operations that exceed a cost limit be automatically shut down? For example, if a company accidentally leaves a process running over the weekend, resulting in charges of over 30,000 Euros, would implementing a kill-cost limit of, let's say, 1,000 Euros have prevented this? I'd appreciate any insights you can provide. Thank you!
no easily, right now anything that has to do with metrics and operations management is very crude :(
@@KnowledgeBankPro At my place, they decided not to go for Fabric, since, right now, it is very expensive... but I love the integration 😞
@@susanODilla can't say I blame them... The current capacity model is something that Microsoft really has to take a look at to see if it makes sense.. To me, it does not
Very helpful Insight and I learn a LOT. Can I get the Dataset so as to tag along with you?
i believe that if you search microsoft.com site, they still have all of our original datasets available for download. We are currently putting a face lift on all of them and once that's done we will publish them on our site www.obvience.com
How can I make the buckets stay in the same order regardless of their value?
unfortunately, the basic waterfall chart does not support it. I am working on a different way to do this that hopefully will work
love their visuals, especially matrix tables
great minds think alike!
really really really really really thank you!!!
How I can integrate Any LLM or agents in powerBI dashboard to ask questions about data? Is it possible?
not right now, maybe with a python visual something like this could be coded, but not out of the box.. Or you can try to use the copilot but I don't know how useful it will be, right now it's not
How does it compare to traditional linear regression? Can it generate good predictions with little training data?
It does linear regression using statistics without having to train the model
If I try to add background colors depending on the different row values for one single unique row. Power bi treats that row(with several values) as a single row. Hence the whole row displays the same color even if it is supposed to display a different color depending on the value. How to fix that?
Are you sure that Andre knows anything about write-back? :)
Ha!
Topic is very interesting, keep going
will do
I only look at costs, however, your fundamental understanding of correlation and variable influence is extremely helpful for me to use the same method, but to look at what is impacting my overall production of my vertically integrated company. Your price/volume/perfect mix was mind blowing. I have new datasets that can better utilize that calculation in Power Bi since you posted that video. I genuinely want to learn how it works, but my challenges is not sales, but cost per hour/by age comparison, the influence of my repairs. And ROI via higher production quality with higher investment in repairs in certain categories.
sounds like you have an interesting puzzle to solve!